
Page Updated 06/27/05

1965 JTWC STUDIES Chapter III
- This Chapter is a collection of studies conducted during the 1965 typhoon season. Some topics appear
in their entirety. Other topics are of a continuing nature and will be completed when data becomes
available.
- The following is a list of the topics discussed in this chapter;
- A. TYPHOON HARRIET - RAPID MOVEMENT BEFORE RECURVATURE
- B. TYPHOONS AMY AND FAYE - UNUSUALLY FAST MOVEMENT AFTER RECURVATURE
- C. AN EXAMPLE OF FALSE RADAR EYE DEVELOPMENT
- D. AN EXAMPLE OF DIFFERENTIAL MOVEMENT AT TWO LEVELS
- E. EXTRATROPICAL SURGE
- F. TIROS VERIFICATION
- G. THE STATISTICAL VERIFICATION PROGRAM
- H. FINAL REPORT ON 700MB NUMERICAL GRID
- I. CHANGES IN SEA SURFACE TEMPERATURE (SST) RESULTING FROM THE TRANSITING OF TYPHOONS SHIRLEY AND TRIX
- J. CHANGES IN MIXED LAYER DEPTH (MLD) RESULTING FROM THE TRANSIT OF TYPHOONS SHIRLEY AND TRIX
bottom of page 22
- A. TYPHOON HARRIET - RAPID MOVEMENT BEFORE RECURVATURE
- Typhoon HARRIET was picked up as a tropical depression south southwest of Guam, and remained
quasi-stationary for 30 hours, gradually building up to a tropical storm of 35 knots. It then moved north
northeast until it was turned to the west by the middle level easterly flow, still as a 35-knot storm.
- In the next 12 hours after curving to the west, HARRIET built up to a 65-knot typhoon and
accelerated to 24-knot forward speed. For the next 3½ days, until it dissipated over Central China, the storm
continued to intensify and moved west northwest at forward speeds of between 16 and 24 knots, with an average
forward speed of 18.1 knots. This was in an area where climatology shows an average speed of 11 to 14 knots for
this time of year.
- A check of the upper air charts for the period showed no indication of any strong easterly
"steering current." In fact, the only significant winds were 40-45 knot southerly winds at 700mb in the
southeast quadrant of the storm. This is usually considered an indicator of slower movement, and
intensification. Throughout the period the 500mb and 700mb subtropical bridge to the north remained weak, and
all indications pointed to a closed circulation to 300mb, another indicator of slow movement.
- The only unusual feature of the storm which did not fit a forecast of slow movement was the
building of a north-south ridge at 300mb and 500mb to the east of the storm, with a very flat gradient to the
west. This increase of heights behind the storm may have resulted in some form of ageostrophic flow to the west
around the storm. However, on the basis of the sparse data available, no definite cause has been found for the
rapid movement of the system.
bottom of page 23
- B. TYPHOONS AMY AND FAYE - UNUSUALLY FAST MOVEMENT AFTER RECURVATURE
- Typhoon AMY was one of the fastest moving typhoons ever seen in the Western Pacific. It first
reached typhoon intensity east of Luzon and immediately started moving north northeast around the western edge
of the subtropical high. It accelerated and deepened gradually until, by 260600Z May 1965, it was a 100 knot
storm moving north northeast at about 28 knots. At this time it was still a small, shallow, intense system
located approximately 180 miles southeast of Okinawa. A fairly deep major trough was located near 123E, with a
closed low over the Central China coast at 700mb.
- In the next 24 hours the 700mb low deepened and moved to a position south of the tip of
Korea, with the trough at 300mb also deepening and moving off the Asian Mainland. Since the subtropical high to
the east did not weaken appreciably, a low level jet developed in the air mass surrounding Typhoon AMY, with
700mb wind speeds in excess of 50 knots. Typhoon AMY began to accelerate rapidly, with little decrease in
intensity.
- By 261800Z, AMY was moving north northeast at about 40 knots, with maximum sustained winds of
80 knots, and by 270000Z it was moving at 46 knots with the storm still of typhoon intensity. Three hours later
it crossed the eastern side of Tokyo Bay with wind speeds of about 45 knots and became extratropical northeast
of Tokyo.
- Another type of system which often moves very rapidly is the typhoon which is becoming
extratropical. This type is typical of late or very early season storms. Typhoon FAYE, of November 1965 is an
excellent example.
- FAYE was a deep storm with a well developed 300mb low at 250000Z and was moving northeast at
about 30 knots. At that time, the storm showed indications of an extratropical surge, with a rapid weakening of
the eye of the storm and an increase in 700mb temperature at the center from 16 to 21 degrees centigrade in a
period of six and one half hours. From the data available, this temperature rise was associated with the
destruction of the closed low above 700mb. Immediately after this the storm accelerated rapidly, moving at an
average speed of 65 knots between 251200Z and 251800Z. At this time FAYE was technically extratropical, but it
still contained winds of over 65 knots and the area covered by winds in excess of 30 knots extended as much as
350 miles from the center.
Using AMY and FAYE as examples, the following are suggested as possible guides to rapid movement of systems which have recurved:
-
- 1. Small, intense storms.
- 2 Shallow storms (top of circulation below 300mb).
- 3. Storms which are becoming extratropical.
- 4. Rapid deepening in the major trough position upstream, resulting in a southward movement of the jet
stream into the path of the storm.
bottom of page 24
- C. AN EXAMPLE OF FALSE RADAR EYE DEVELOPMENT
- When Typhoon DINAH passed over Taiwan on the 18th and 19th of June 1965, it provided a well
documented case of false eye development. The false eye was picked up by land radar, TIROS, and both visually
and on radar by reconnaissance aircraft (see Figure 3-1) while the actual circulation center was verified by
doppler winds.
- An EC121K aircraft of VW-1 made a radar fix on Typhoon DINAH over the southeast coast of
Taiwan at 181454Z. At that time the storm was well defined, with a wall cloud 3-5 miles thick just moving over
land. At 181500Z the wall cloud was still well enough defined to be picked up by land radar on Miyako Jima,
about 265 miles from the storm. However, by 181900Z the storm center had moved over the central highlands of
Taiwan and land radar reported the eye had dissipated, although the center could still be estimated by using
spiral overlays on the feeder bands.
- At 182145Z an Air Force WB-50, with Captain A. C. Korelishn aboard as Weather Officer made a
fix of the 500mb wind center over north central Taiwan. At that time he reported no radar returns or clouds at
flight level, but a definite wind circulation. The reconnaissance flight was continued with a 700mb
circumnavigation of the island, during which southerly surface winds of 45 knots were observed off the east
coast. At' 190100Z the aircraft was contacted by a land radar station, which vectored it into a "radar eye"
near 26.1N 122.8E, The following is quoted from a post flight report by Captain Korelishn.
- "The radar returns were circular in nature and they almost formed a completely closed circle
except for the south quadrant. Visible tops ranged from 8-9 to 15 thousand feet. The echo width averaged 4
miles and the intensity of the returns was strong. Once entry had been made into the center of the radar
return, it visually showed all signs of a typhoon cloud structure. Circular bands of strato-cumulus, with
center tops to 4 thousand feet increasing in height to 8 thousand feet were welded into the wall cloud. The 7/8
cloud coverage allowed sufficent area to view the sea surface. The wind field on the surface was well defined
180-190 degrees at 40 knots while flight level winds at 700mb remained at approximately 210-220/30-35
knots,"
- After leaving the "cloud eye," the WB-50 put the wind on its wing and located a 700mb wind
center at 26.6N 122.2E. Since the surface wind at this point was still approximately 150/25 knots, the search
was continued, and a surface wind center located at 26.1N 121.6E at 190206Z. (Approximately 60 miles west of
the cloud center). In the meantime, TIROS reported a center at 25.0N 122.0E at 190144Z and Shimen land radar
reported an eye at 26.0N 122.6E at 190200Z, near the cloud eye reported earlier by the aircraft.
- Land radar reports at 190500Z and a VW-1 penetration at 190932Z indicated that a wall cloud started to form around the surface wind center during the next 12 hours. In fact, VW-1 reported a partial wall cloud 5 miles thick in the northeast quadrant. No further reports were received of the cloud eye to the east, which apparently dissipated.
bottom of page 25
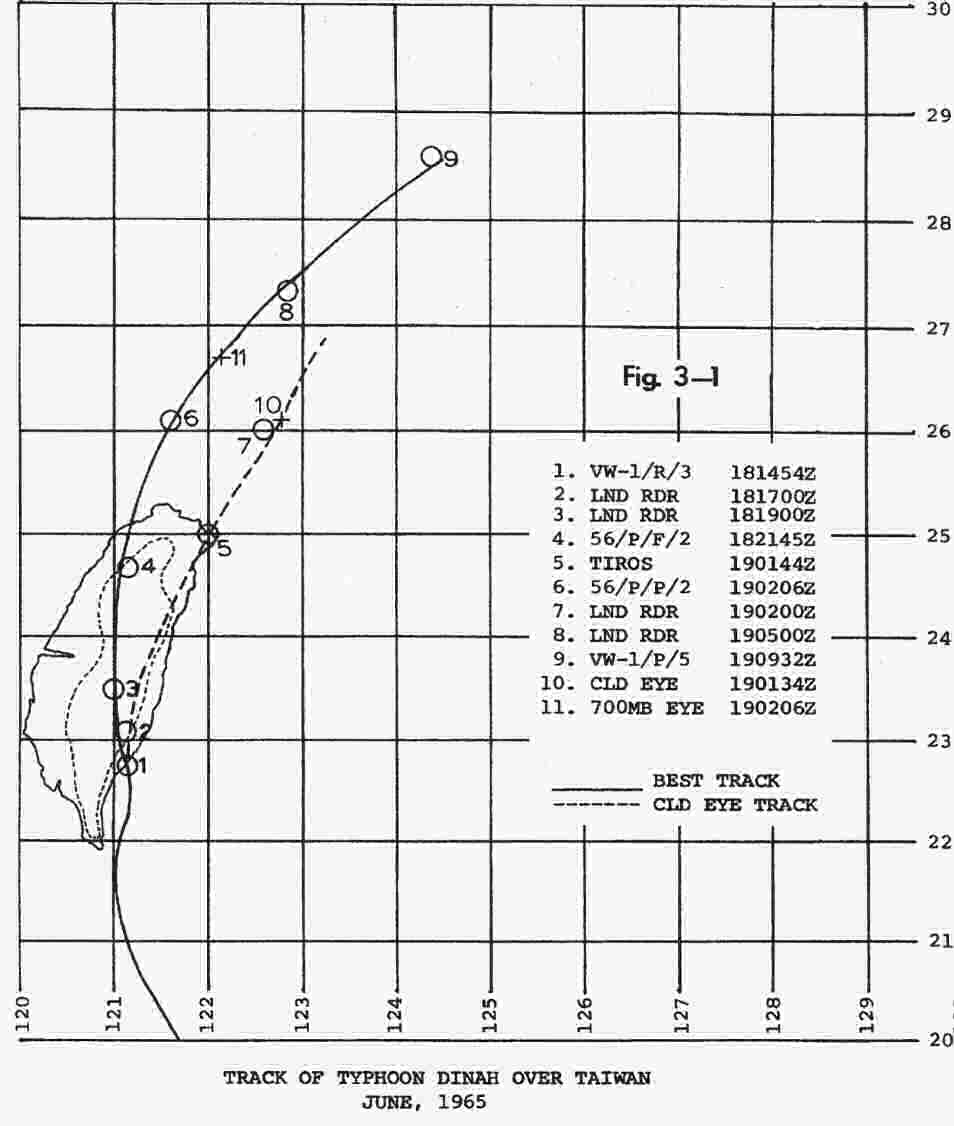 TRACK OF TYPHOON DINAH OVER TAIWAN JUNE, 1965
bottom of page 26
- It is interesting to note that, except for airborne reconnaissance, all available data
between 181700Z and 190500Z indicated a track at least 60 miles to the right of the actual storm movement, and
would undoubtedly have forced a forecast of recurvature well south of Kyushu. Actually, the storm followed the
forecast track and moved over central Kyushu as an extra-tropical system.
- This "shearing off" of a cloud (and radar) eye during the passage of a storm over a steep
mountain range has been observed at least once before, during the passage of Hurricane FRANCES over Guadeloupe
Island in the Caribbean Sea on 1 October 1961. It has been suspected in typhoons before, but this is the first
case in which synoptic reports of both centers were available.
bottom of page 27
- D. AN EXAMPLE OF DIFFERENTIAL MOVEMENT AT TWO LEVELS
- In its early stages, the cyclone that later became Typhoon JEAN was a good example of the
damping effect of differential advection on a center.
- JEAN was picked up as T.D. 17 on the 26th of July, 1965, between Truk and Eniwetok. At that
time, winds of 30 knots were reported, and both low level Southern Hemisphere indrafting and divergence at
200mb favored fairly rapid development.
- The 700mb contour pattern and the surface pressure pattern for 270000Z are typical of those
occurring in the following three days. The 700mb (and 500mb) patterns showed a weak trough in the westerlies
well to the north of the tropical depression, with an almost continuous ridge 10 degrees north of the center,
and an apparent "steering flow" to the west northwest. On the other hand, the surface pattern showed a deep
trough to the north and a comparatively tight gradient in the southerly winds east of the center.
- The resulting movement over Guam - and an estimate of the movement of two earlier surface
centers - is shown on the attached chart (figure 3-2). The 700mb low apparently followed a regular track to the
west northwest at about 14 knots. However, each time a surface low developed, it immediately tried to move
north northwest and weakened rapidly as it moved out from under the low aloft. This is shown clearly by the
lower levels of the Guam rawins during the time the center was passing (figure 3-3). The surface center, with
very light winds, passed just north of Guam, while the center above 8000 feet passed to the south. Guam
actually experienced a dead calm and thick fog during the passage of the center.
- After three more days, the 700mb and surface flow became parallel, and Typhoon JEAN developed
in the no data area between Guam and Luzon.
bottom of page 28
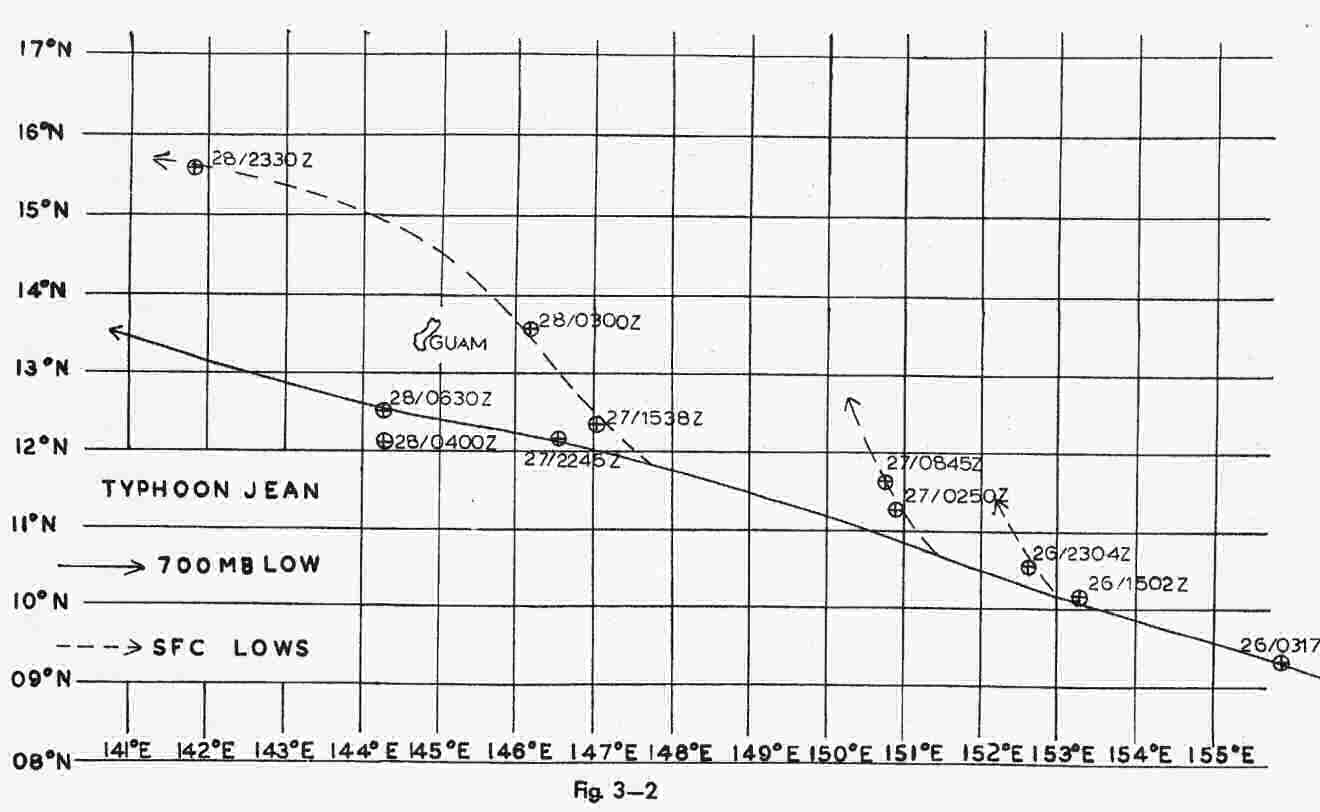 Fig. 3-2
TYPHOON JEAN
bottom of page 29
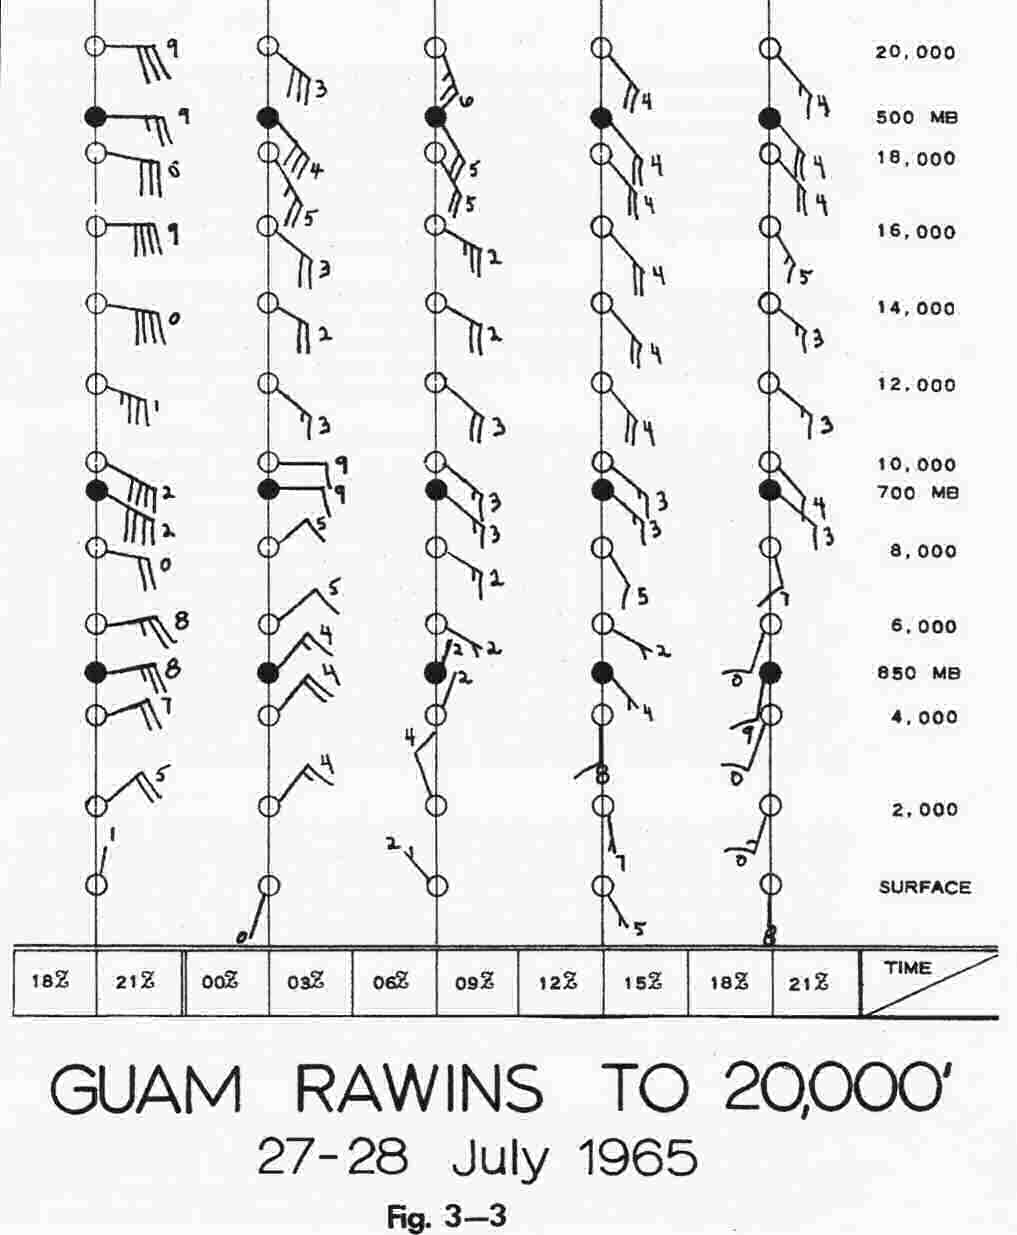 Fig. 3-3
GUAM RAWINS TO 20,000' 27-28 July 1965
bottom of page 30
- E. EXTRATROPICAL SURGE
- Following the analysis of extratropical surge in Typhoon HOPE (See JTWC Studies in the 1964
Annual Typhoon Report), a search was made for other well documented examples of this phenomenon. In most cases,
it was found that operational reconnaissance did not give the coverage necessary to fully outline the surge
process. However, two additional examples have been found which fit the pattern observed in Typhoon HOPE and in
14 other cases observed since 1962 data available indicates the process did occur, although complete
documentation is lacking.
- Typhoons JODY (October 1963) and BESS (October 1965) have been plotted, using the moving
coordinate technique outlined in the 1964 report, Due to the subjective nature of surface wind reports, only
700mb doppler winds have been analyzed for these two storms, but otherwise the charts are similar to those made
for Typhoon HOPE.
- Typhoon JUDY has been included in this study because of the large rise in 700mb center
temperature at a relatively high latitude and the excellent peripheral data, especially in the south and west
quadrants. The track of the storm was very similar to that followed by Typhoon BESS two years later. On the 2nd
of October 1963, sparse available data showed a flat temperature gradient of 9-11 degrees C. at 700mb
surrounding a small 17 degree center, with maximum 700mb winds of 55-60 knots except for one 80 knot report 30
miles south southwest of the eye. By the 3rd (figure 3-4) a tongue of cold air had penetrated to the south
quadrant of the storm, with a 70 knot 700mb .wind maximum ahead of it about 100 miles -from the center.
Reconnaissance center reports indicated an eye 3 miles in diameter with moderate to severe turbulence and
maximum 700mb winds of 110 knots near the wall cloud at 022200Z. By 030405Z the center had enlarged to 8 miles
in diameter with maximum 700mb winds near the center of 90 knots
- On the 4th (figure 3-5) reconnaissance reported a poorly defined eye, with no strong winds
near the center. The cold air had almost completely cut off the warm air tongue at this time, with an 80 knot
wind maximum on the leading edge of the cold air tongue. In spite of the cut-off of the warm air tongue, the
700mb temperature at the center rose to 21 degrees at 032100Z and 24 degrees at 040400Z over a very small
area.
- Here again, no operational requirement could justify a flight on the 5th of October. The last
reported data was a flight by a VW-1 aircraft into the center on the evening of the 4th, which found maximum
700mb winds of 67 knots and a center temperature of 21 degrees C.
- Typhoon BESS was a large storm with a circulation over 600 miles across and surface winds
near 150 knots which moved almost due north near 144E during early October 1965. By the 3rd of October it had
turned to the northeast near 31N and accelerated slightly to 12 knots forward speed with winds at both surface
and 700mb weakening slowly. The chart for the daylight
bottom of page 31
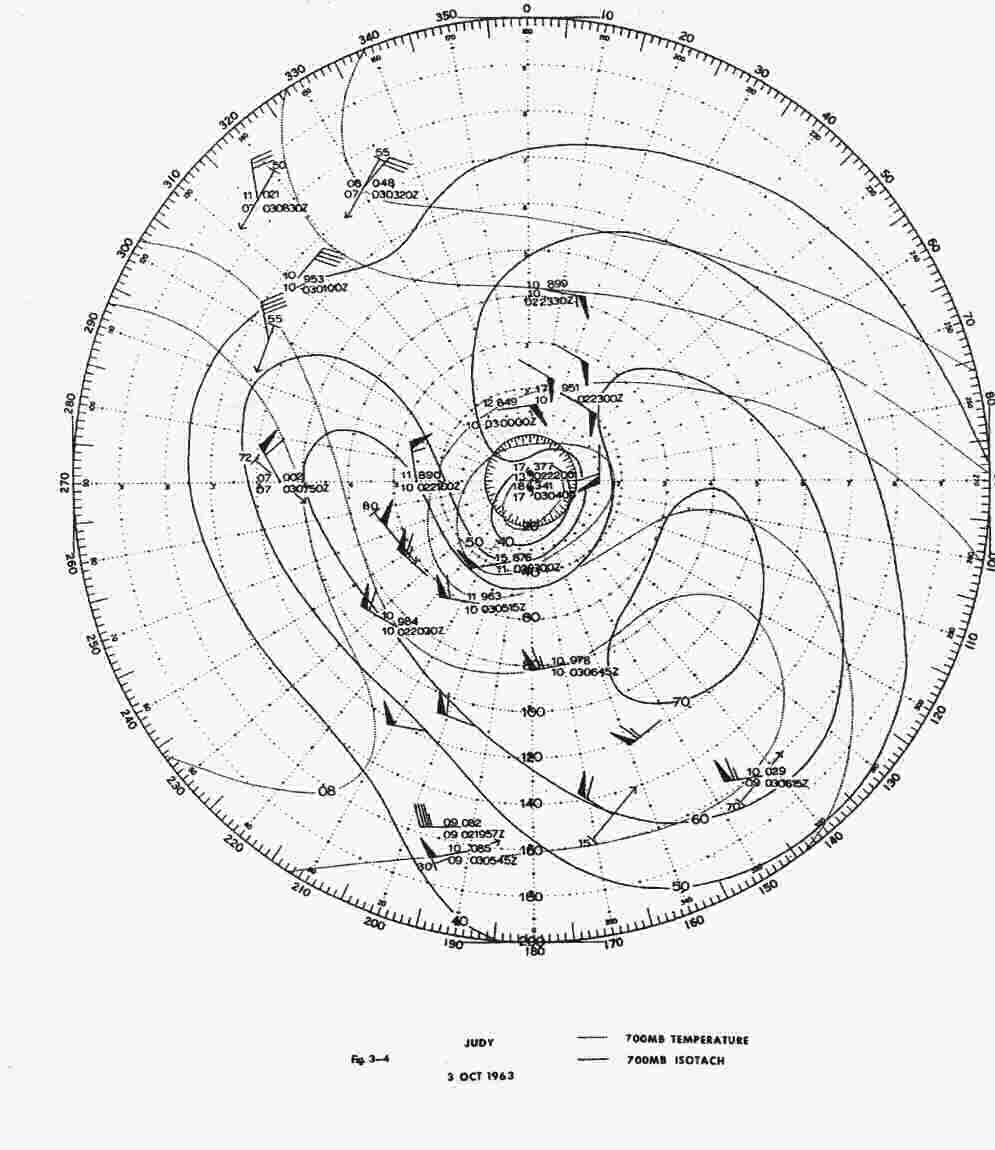 Fig. 3-4
JUDY 3 Oct 1963 700mb TEMP/ISOTACH
bottom of page 32
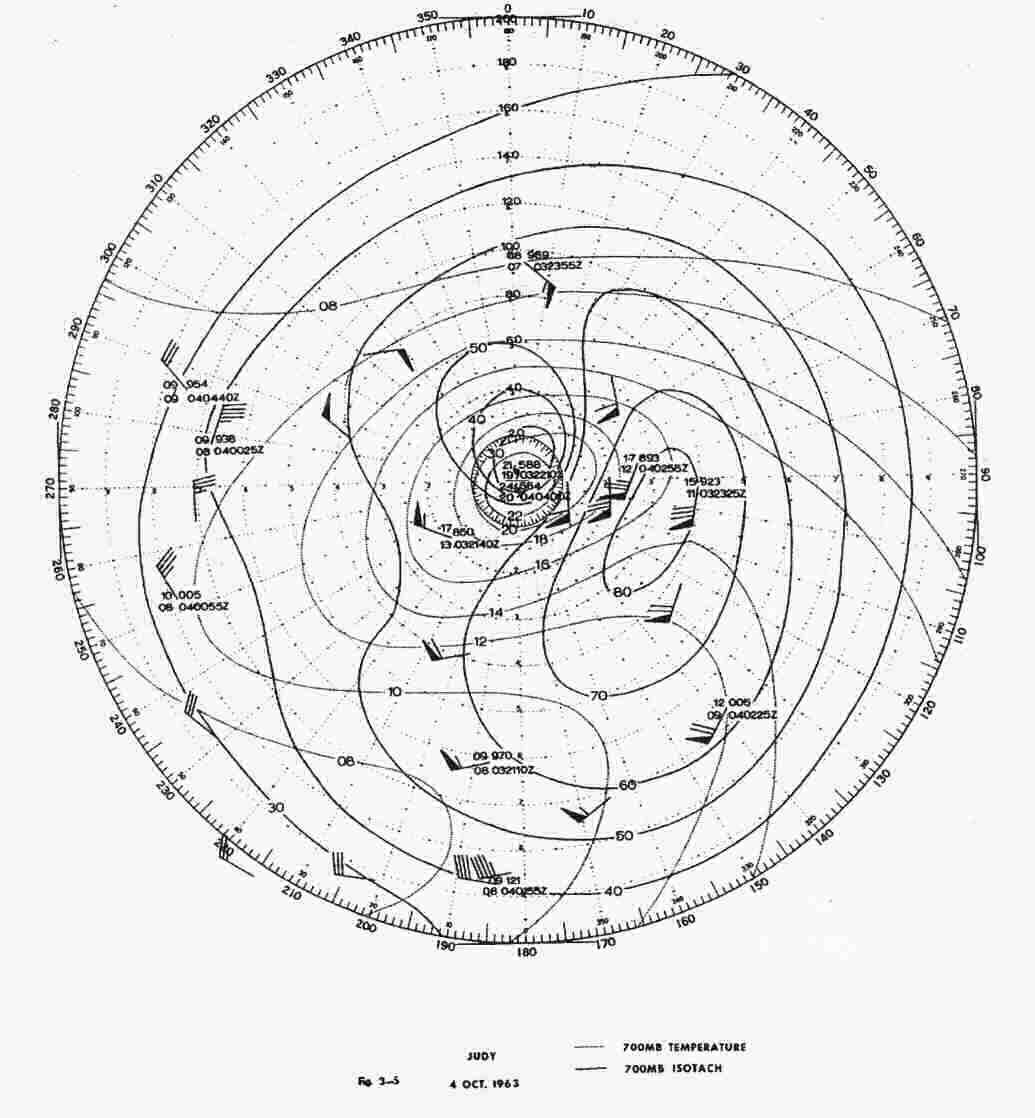 Fig. 3-5
JUDY 4 Oct 1963 700mb TEMP/ISOTACH
bottom of page 33
- fixes October 3rd (figure 3-6) shows a small 60 knot wind maximum in the southeast quadrant about 50 miles
from the center and a 50 knot maximum in the northwest quadrant on the leading edge of the cold air tongue. By
the next day (figure 3-7) the cold air had swung into the south quadrant and the maximum wind area was lying
60-80 miles southeast of the center, with 700mb winds in excess of 70 knots. A second maximum of about 70 knots
was located 80-100 miles northwest of the center on the leading edge of the warm air tongue.
- Here again, as in Typhoon HOPE in 1964, no operational requirement could be used to justify
reconnaissance of the extratropical system on the following day. However, what peripheral data existed showed
the development of a normal extratropical warm type occlusion with surface winds of 50-60 knots.
- Typhoon BESS was unusual in that the 700mb temperature in the center rose to a maximum of 21
degrees C. on the 3rd, then dropped back to 18 degrees on the 4th. This was probably due to the extreme
northward movement of the center, which was at 35N on the 4th. In almost every other case studied the high
center temperature at 700mb remained until the system was completely extratropical.
- Another interesting feature of BESS was the movement of the maximum surface wind belt. The
maximum surface winds moved from 30-40 miles from the center on the 4th to 60-100 miles from the center on the
5th. Even on a qualitative basis this represents a tremendous increase in kinetic energy in the system.
- It appears from the evidence available that extratropical surge is a common phenomenon,
especially in early and late season storms. Although the effects are masked by changes due to landfall, it is
probable that the same process is responsible for the sudden increases in intensity occasionally observed in
the eastern quadrant of storms approaching Japan (and possibly also those approaching the Gulf Coast of the
United States). It is felt that a modest research effort, such as a double penetration at 1500 feet and 700mb
by doppler equipped aircraft every 6-12 hours while the process is going on would yield considerable useful
data.
- With the installation of new equipment programmed for reconnaissance aircraft, additional
data will be obtained which should determine the relationship between the 700mb and low level wind
fields.
- In the meantime, from evidence at hand, the following are suggested as some typical changes
in a storm becoming extratropical.
- 1. Wall cloud dissipates and clouds in center become stratiform.
- 2. 700mb height in center rises 50-100 meters in 24 hours.
bottom of page 34
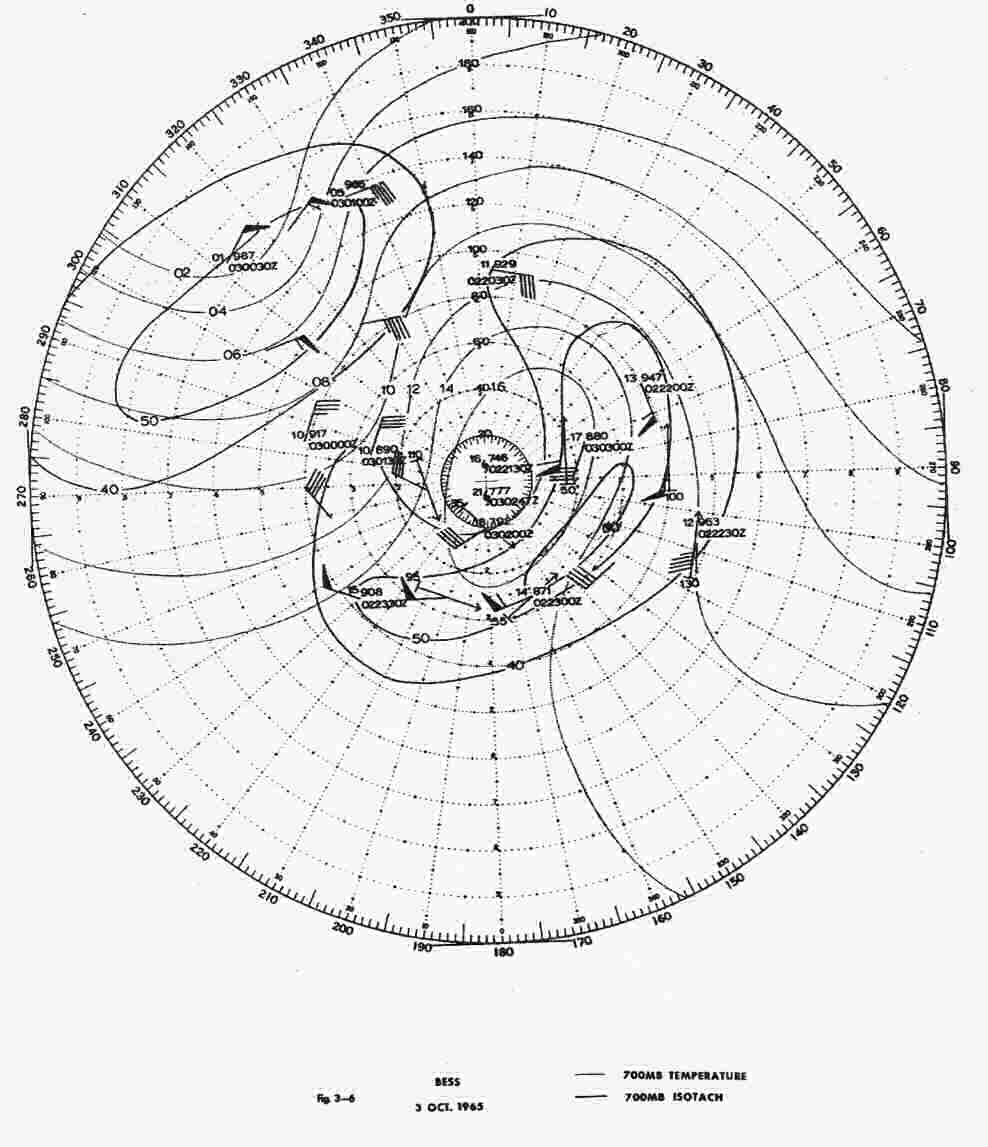 Fig. 3-6
BESS 3 Oct 196 700mb TEMP/ISOTACH
bottom of page 35
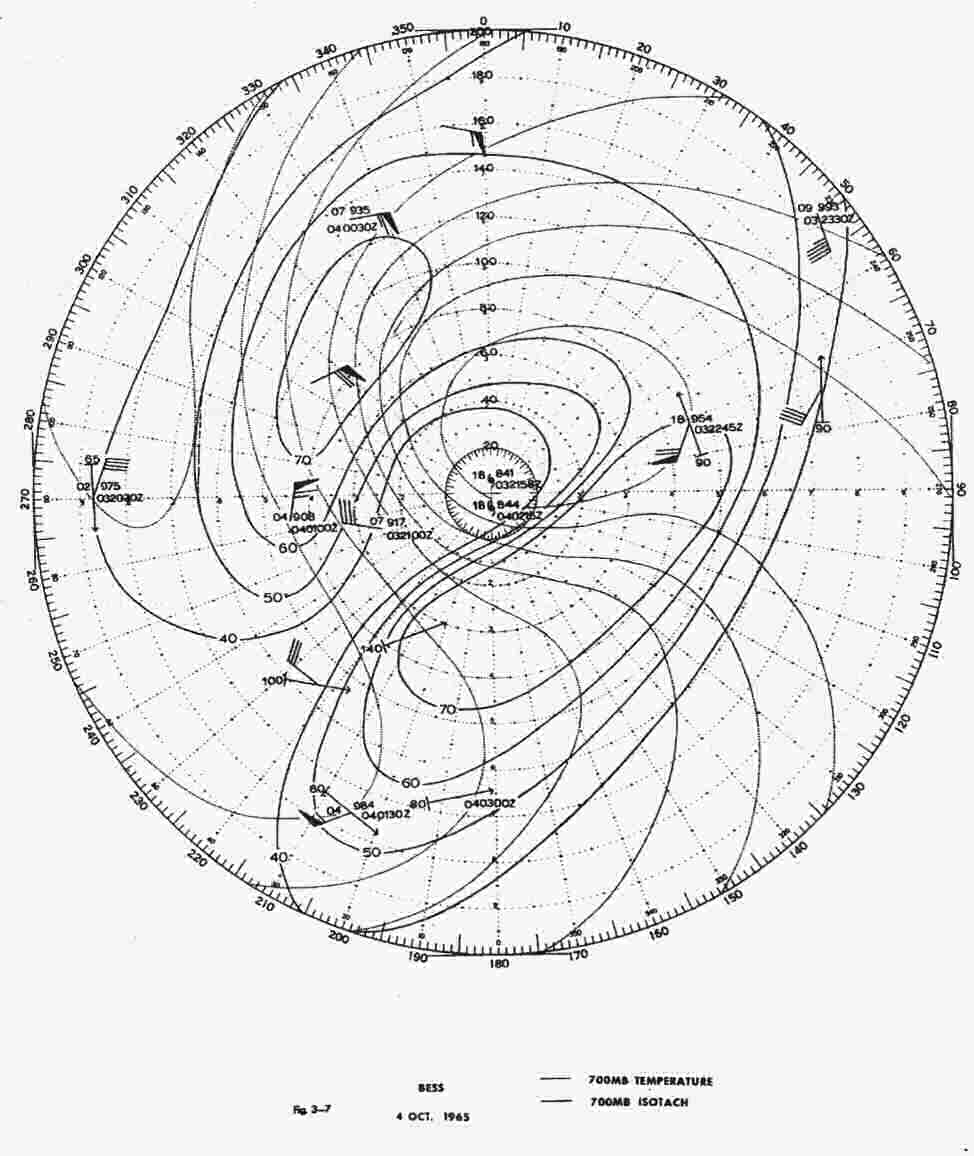 Fig. 3-7
BESS 4 Oct 196 700mb TEMP/ISOTACH
bottom of page 36
- F. TIROS VERIFICATION
- During the 1965 typhoon season satellite information was used in conjunction with other
meteorological data to evaluate the synoptic situation. In some cases the initial information received
indicating a suspect area was supplied by the satellite bulletin.
- This verification was compiled to determine the accuracy of the data furnished by satellite
bulletins. Stage A reports were not verified. Stage B, C, and D reports were verified using average values
indicated by figure 3-8 when diameter and band information was not available. Figure 3-9 was used when diameter
and band information was available.
- Table 3-1 shows the statistics that were used in this verification. The information in
columns 3, 8, 9, 10, and 11 was received by message. From a comparison of columns 2 and 3 of table 3-1, the
location error in nautical miles (column 4) was obtained. The TIROS wind estimate (column 5) was obtained
utilizing the diameter (DIA) and bands (BUDS) (columns 10 and 11 of table 3-1) and entering figure 3-9. The
difference between columns 5 and 6 yielded column 7.
- When wind speeds changed significantly along the best track the wind speed was interpolated
for verification purposes. Otherwise the wind speed at the previous warning time was used. The wind error
average over 61 verified cases was seventeen knots. This error would be significant for cyclones in the initial
stages of formation but become progressively less significant as the intensity of the storm increased.
- The TIROS storm positions were verified against the storm best track. The accuracy of 75
satellite positions varied from 0 to 425 miles with an average error of 81 miles.
- NOTE: Figure 3-8 and 3-9 are taken from: Memorandum, U. S. Department of Commerce, Weather
Bureau: 18 June 1964, Subject: NWSC Support to Hurricane and Typhoon Forecast Centers
bottom of page 37
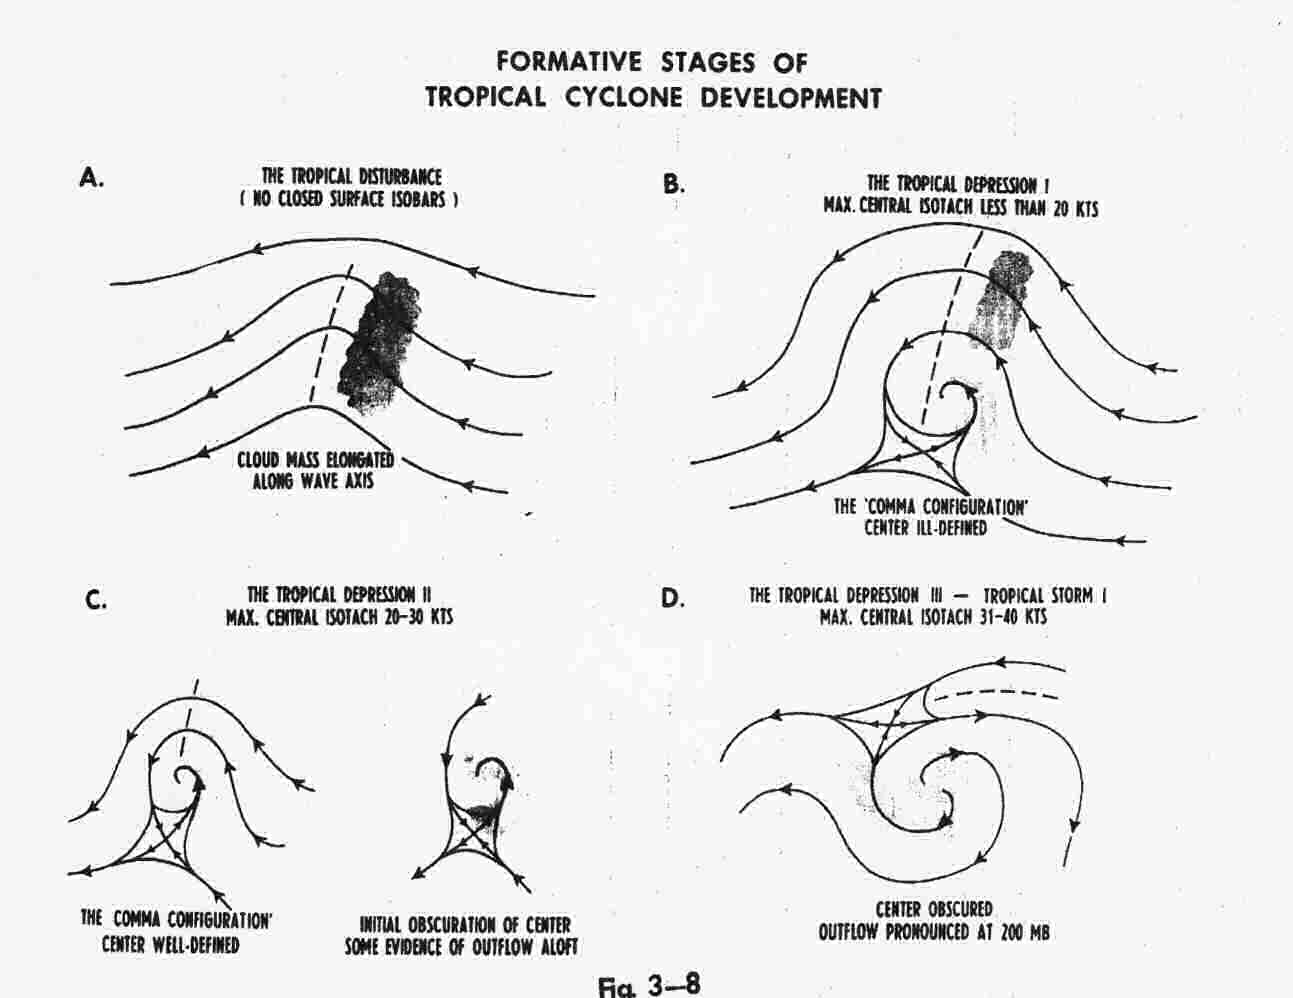 Fig. 3-8
FORMATIVE STAGES OF TROPICAL CYCLONE DEVELOPMENT
bottom of page 38
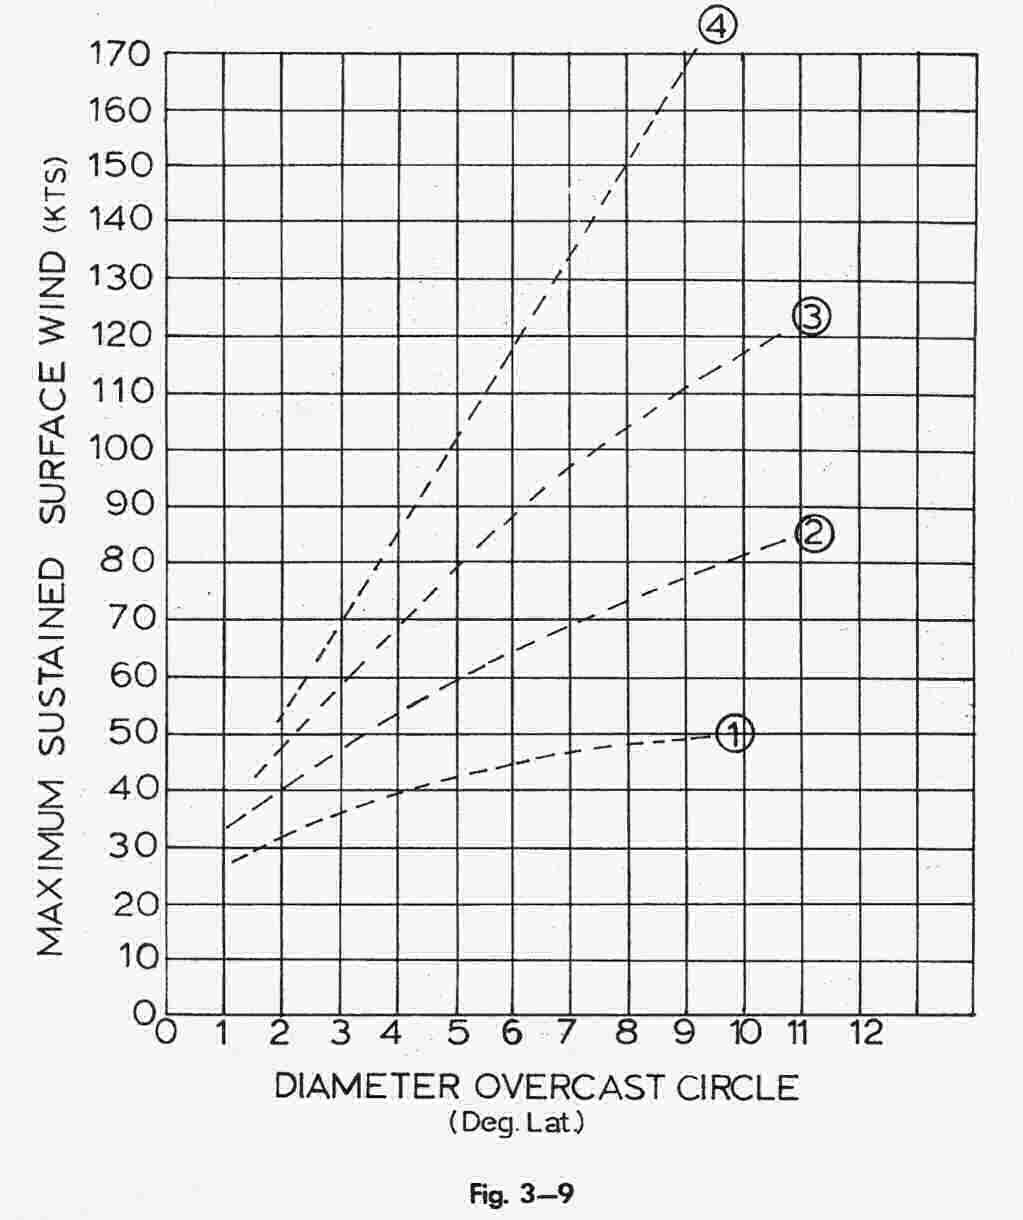 Fig. 3-9
TRIOS WIND ESTIMATE CHART
bottom of page 39
| CYCLONE | POSIT BEST TRACK | POSIT SATELLITE | POSIT ERROR | TIROS WND | BEST TRACK WND | WIND DIFF | TIME ZULU | STAGE | DIA | BNDS | ||
|---|---|---|---|---|---|---|---|---|---|---|---|---|
| PATSY | 13.4N | 128.3E | 13.5N | 127.5E | 43 | 40 | Formative Stages | 190408 | D | 4 | 1 | |
| 17.0N | 129.1E | 18.0N | 128.0E | 86 | 60 | 65 | -05 | 210314 | X | 5 | 2 | |
| *65 | ||||||||||||
| SARAH | 07.0N | 111.0E | 07.0N | 111.0E | 0 | 140530 | ||||||
| 06.8N | 106.4E | 07.0N | 107.0E | 87 | 43 | 45 | -2 | 150523 | D | 5 | 1 | |
| 07.6N | 104.9E | 09.5N | 104.0E | 123 | 40 | 160711 | ||||||
| *70 | ||||||||||||
| VERA | 10.4N | 128.2E | 12.0N | 127.0E | 117 | 35 | 35 | 060426 | D | 5 | 0 | |
| *117 | ||||||||||||
| AMY | 09.8N | 131.1E | 11.0N | 128.0E | 195 | 40 | 25 | 15 | 210216 | D | 4 | 1 |
| *195 | ||||||||||||
| BABE | 15.4N | 112.5E | 15.0N | 113.0E | 37 | 60 | 010411 | |||||
| 15.9N | 113.8E | 17.0N | 115.0E | 98 | 56 | 50 | +06 | 020323 | D | 4.5 | 2 | |
| *68 | ||||||||||||
| CARLA | 24. 1N | 125.6E | 23.0N | 127.5E | 120 | 70 | 100 | -30 | 020225 | X | 4 | 3 |
| 29.2N | 129.6E | 29.0N | 129.5E | 10 | 20 | 30 | -10 | 030219 | B | X | X | |
| *65 | ||||||||||||
| DINAH | 11.1N | 148.3E | 11.0N | 149.0E | 43 | 43 | 25 | 18 | 110056 | X | 5 | 1 |
| 11.6N | 144.4E | 12.5N | 142.5E | 125 | 43 | 120050 | D | 5 | 1 | |||
| 12.2N | 139.8E | 13.0N | 140.0E | 51 | 60 | 65 | -5 | 130037 | X | 5 | 2 | |
| 14.3N | 131.6E | 14.0N | 131.0E | 37 | 90 | 110 | -20 | 150221 | X | 5 | 3+ | |
| 14.4N | 131.2E | 15.0N | 131.0E | 37 | 105 | 110 | -5 | 150511 | X | 5 | 4 | |
| 15.9N | 127.7E | 15.8N | 128.4E | 43 | 105 | 130 | -25 | 160212 | X | 5 | 4 | |
| 17.4N | 123.9E | 17.5N | 124.0E | 11 | 105 | 150 | -55 | 170158 | X | 5 | 4 | |
| 20.7N | 121.2E | 21.0N | 122.0E | 49 | 90 | 140 | -60 | 180152 | X | 5+ | 3+ | |
| 25.9N | 121.5E | .25.0N | 122.0E | 63 | 37 | 40 | -3 | 190144 | X | 3 | 1 | |
| *51 | ||||||||||||
| EMMA | 18.3N | 124.2E | 17. 0N | 120.0E | 253 | 50 | 240251 | |||||
| 22.6N | 124.4E | 17. 0N | 120.0E | 425 | 48 | 45 | 3 | 250250 | X | 8 | 1 | |
| *336 | ||||||||||||
| FREDA | 13.5N | 135.5E | 16. 0N | 134.0E | 175 | 42 | 70 | -38 | 090039 | X | 5 | 1 |
| 14.4N | 127.9E | 13. 0N | 128.0E | 83 | 92 | 120 | -28 | 120206 | X | 7 | 3+ | |
| 17. 1N | 123.3E | 17.5N | 125.0E | 103 | 105 | 140 | -35 | 130158 | X | 8 | 3+ | |
| 18.3N | 116.9E | 17.0N | 117.0E | 77 | 96 | 85 | 11 | 140147 | X | 7 | 3 | |
| 20.5N | 110.5E | 19.5N | 111.0E | 65 | 88 | 100 | -12 | 150142 | X | 6 | 3 | |
| *101 | ||||||||||||
| GILDA | 13.3N | 132.2E | 13.0N | 128.0E | 245 | 170119 | A | X | X | |||
| 18.9N | 118.6E | 17. 5N | 117.0E | 123 | 35 | 200053 | A | X | ||||
| 19.3N | 112.4E | 18. 0N | 112.0E | 77 | 60 | 60 | ±00 | 220236 | X | 5 | 2 | |
| 21.5N | 111.3E | 20. 0N | 110.0E | 113 | 54 | 35 | 19 | 230225 | X | 4 | 2 | |
| 21.4N | 108.2E | 19. 0N | 108.0E | 140 | 60 | Dissipated | 240217 | X | 5 | 2 | ||
| *140 | ||||||||||||
| HARRIET | 11.1N | 143.1E | 07.5N | 140.0E | 283 | 35 | 220031 | |||||
| 13.5N | 141.3E | 14. 0N | 141.0E | 35 | 80 | 65 | 15 | 230026 | X | 5 | 3 | |
| 17.6N | 134.6E | 17.0N | 133.0E | 97 | 80 | 70 | 10 | 240016 | X | 5 | 3 | |
| *128 | ||||||||||||
| JEAN | 11.8N | 150.0E | 10. 0N | 149.0E | 123 | 20 | 25 | -5 | 270155 | B | X | |
| 18. 1N | 130.6E | 18.0N | 132.0E | 80 | 70 | 75 | -5 | 010158 | X | 4 | 3 | |
| 23.2N | 127.5E | 23.0N | 127.0E | 31 | 78 | 90 | -12 | 030240 | X | 4 | 3+ | |
| 25. 6N | 126.8E | 25.5N | 127.0E | 15 | 85 | 130 | -45 | 040212 | X | 4 | 4 | |
| *62 | ||||||||||||
| KIM | 30.8N | 142.4E | 31.5N | 142.5E' | 41 | 58 | 45 | 13 | 050143 | X | 3 | 3 |
| *41 | ||||||||||||
| LUCY | 11.0N | 177.0E | 112348 | A | X | X | ||||||
| 26.8N | 143.7E | 27. 0N | 144, 0E | 20 | 78 | 120 | -42 | 190123 | X | 5 | 3 | |
| 31.2N | 137.8E | 31.0N | 137.5E | 20 | 85 | 120 | -35 | 210216 | X | 4 | 4 | |
| 33.6N | 137.6E | 33.5N | 137.5E | 10 | 102 | 120 | -18 | 220137 | X | 5 | 4 | |
| *17 | ||||||||||||
| MARY | 19,2N | 134.8E | 18. 5N | 135.0E | 45 | 63 | Formative Stages | 150142 | X | 3.5 | 3 | |
| 21.1N | 129.1E | 20. 0N | 129.5E | 66 | 85 | 135 | -50 | 170223 | X | 4 | 4 | |
| 24.8N | 120.9E | 26.5N | 122.0E | 121 | 96 | 80 | 16 | 190354 | X | 7 | 3 | |
| *77 | ||||||||||||
| OLIVE | 25.5N | 147.8E | 26. 0N | 147.0E | 55 | 101 | 130 | -29 | 292209 | X | 5 | 4 |
| 33.7N | 146.2E | 34. 0N | 146.0E | 21 | 70 | 80 | -10 | 312213 | X | 4 | 3 | |
| *38 | ||||||||||||
| POLLY | 13.5N | 118.4E | 13. 0N | 122.0E | 210 | 32 | 25 | 7 | 301919 | D | 2 | 1 |
| *2l0 | ||||||||||||
| ROSE | 17.5N | 124.9E | 17.5N | 125.0E | 4 | 90 | 012258 | |||||
| 17.7N | 124.3E | 16. 0N | 124.0E | 100 | 43 | 95 | -52 | 020244 | D | 5 | 1 | |
| *52 | ||||||||||||
| SHIRLEY | 16.2N | 142.5E | 17.5N | 145.0E | 165 | 20 | 040146 | |||||
| 19.0N | 142.1E | 21. 0N | 114. 0E | 162 | 54 | 20 | 34 | 050115 | X | 4 | 2 | |
| 22.3N | 137.1E | 23.5N | 137.0E | 71 | 70 | 100 | -30 | 070156 | X | 4 | 3 | |
| *136 | ||||||||||||
| TRIX | 18.7N | 136.6E | 18. 0N | 136.0E | 53 | 96 | 85 | 11 | 120035 | X | 7 | 3 |
| 20.7N | 133.7E | 20.5N | 134.5E | 37 | 80 | 100 | -20 | 130058 | X | 5 | 3 | |
| 24.6N | 129.6E | 24.5N | 129.0E | 32 | 110 | 160035 | X | 4 | ||||
| 24.9N | 129.9E | 25.2N | 129.8E | 19 | 118 | 110 | 8 | 160228 | X | 6 | 4 | |
| 30.8N | 133.9E | 32.0N | 134.5E | 81 | 77 | 100 | -23 | 170200 | X | 4.5 | 3 | |
| *44 | ||||||||||||
| WENDY | 13.3N | 147.1E | 14.5N | 149.0E | 130 | 25 | 25 | 0 | 180126 | C | X | X |
| 21.7N | 136.1E | 21.0N | 136.0E | 44 | 25 | 35 | -10 | 210138 | C | X | X | |
| 24.2N | 132.6E | 24. 0N | 133.5E | 52 | 36 | 50 | -14 | 230218 | D | 3 | 1 | |
| 27.2N | 133.7E | 29.0N | 134. 0E | 109 | 40 | 45 | -5 | 240150 | D | 4 | 1 | |
| 31.9N | 138.5E | 32.5N | 139.0E | 42 | 40 | 50 | -10 | 250121 | D | 4 | 1 | |
| *75 | ||||||||||||
| AGNES | 17.5N | 112.4E | 17.0N | 112.0E | 36 | 36 | 45 | -9 | 260300 | D | 3 | 1 |
| 21.1N | 112.2E | 210N | 113.0E | 48 | 68 | 60 | 8 | 270802 | X | 4 | 3 | |
| *42 | ||||||||||||
| BESS | 15.6N | 145.6E | 15.5N | 144.5E | 54 | 60 | 70 | -10 | 280128 | X | 5 | 2 |
| *54 | ||||||||||||
| CARMEN | 14.5N | 148.9E | 15.0N | 149.0E | 34 | 40 | 55 | -15 | 010118 | D | 4 | 1 |
| 23.3M | 145.7E | 24.0N | 144.5E | 80 | 135 | 150 | -15 | 080130 | X | 7 | 4 | |
| *57 | ||||||||||||
| DELIA | 26.6N | 146.4E | 26.0N | 146.0E | 42 | 88 | 75 | +03 | 180133 | X | 5 | 3 |
| *42 | ||||||||||||
| ELAINE | 18.1N | 112.6E | 17.0N | 113.0E | 68 | 36 | 45 | -9 | 110238 | X | 3 | 1 |
| *68 | ||||||||||||
| FAYE | 09.7N | 147.2E | 10.0N | 147.0E | 21 | 36 | 35 | 1 | 200144 | X | 3 | 1 |
| 10.8N | 140.8E | 10.8N | 141.0E | 13 | 53 | 75 | -22 | 210215 | X | 2.5 | 3 | |
| 12.3N | 135.6E | 12.0N | 134.0E | 38 | 118 | 120 | -2 | 220237 | X | 6 | 4 | |
| 14.3N | 129.7E | 15.0N | 129.5E | 30 | 135 | 130 | 5 | 230157 | X | 7 | 4 | |
| *26 | ||||||||||||
TABLE 3-1
*AVG ERROR PER STORM
bottom of page 43
- G. THE STATISTICAL VERIFICATION PROGRAM
- This program has been started to provide using agencies with a better measure of the accuracy
of tropical storm forecasts and to help point out major sources of forecast errors. It is being run this year
with hand computers, and will be programmed for the new CDC 3100 computer to be installed at Fleet Weather
Central Guam later this year.
- The program provides a breakdown of mean errors by latitude bands for 24, 48, and 72 hour
forecasts, and also two measures of dispersion.
- 1. The root mean square (R.M.S.) of vector errors.
- Assuming a circular normal distribution of errors, 63% of the forecasts made should
verify within one R.M.S. of the actual storm position and 98% within two R.M.S. (See AWS Technical Report
#164, dated August 1962).
- 2. The R.M.S. of right angle errors. (Equivalent in this case to the standard deviation)
- Assuming a normal distribution, 68%. of the forecasts should be within one R.M.S. right
or left of the track and 95% within two R.M.S.
- When the machine program becomes available, it is planned to include a breakdown of
errors by quadrant in relation to the storm track. This will point out any consistent speed errors or
consistent errors to right or left of track. Also, it is planned to specify whether the track is to the
west or east of north to identify any consistent errors made before or after recurvature.
- Since the R.M.S. of vector errors should be approximately 1.4 times the R.M.S. of right
angle errors for a circular distribution, these two figures can be used as a check on the shape of the
"error envelope", that is, to compare speed and track errors. Preliminary analysis of 1965 statistics (see
table 3-2) indicate speed errors about 20% greater than track errors. More detailed analyses of this type
are planned.
- This program is expected to provide a better basis for command decisions involving
tropical storms, and also to point out areas of maximum error so that they can be given top priority in
developing forecast aids.
- 1. The root mean square (R.M.S.) of vector errors.
bottom of page 44
| 1. | 2. | 3. | ||
|---|---|---|---|---|
| R.M.S OF VECTOR ERROR | 0.707 X R.M.S OF VECTOR ERROR | STANDARD DEVIATION OF RIGHT ANGLE ERROR | PERCENT VARIATION (2-3)/2 |
|
| 24 hour TOTAL |
182 | 129 | 103 | 20% |
| UNDER 20N | 161 | 114 | 96 | 16% |
| 20N - 30N | 162 | 115 | 98 | 15% |
| ABOVE 30N | 263 | 186 | 130 | 30% |
| UNDER 35N | 170 | 120 | 100 | 17% |
| ABOVE 35N | 295 | 209 | 142 | 32% |
| 48 hour TOTAL |
358 | 253 | 211 | 17% |
| UNDER 20N | 314 | 222 | 189 | 15% |
| 20N - 30N | 333 | 235 | 214 | 9% |
| ABOVE 30N | 469 | 332 | 239 | 28% |
| UNDER 35N | 340 | 240 | 212 | 12% |
| ABOVE 35N | 499 | 353 | 204 | 19% |
| 72 hour TOTAL |
494 | 349 | 294 | 16% |
| UNDER 20N | 397 | 281 | 254 | 10% |
| 20N - 30N | 463 | 327 | 294 | 10% |
| ABOVE 30N | 627 | 443 | 333 | 25% |
| UNDER 35N | 451 | 319 | 295 | 8% |
| ABOVE 35N | 760 | 537 | 284 | 47% |
TABLE 3-2
bottom of page 45
- H. FINAL REPORT ON 700MB NUMERICAL GRID
- The 700Mb numerical grid forecast (See 1964 Annual Typhoon Report) was tested on a total of
six storms, using four different smoothing techniques It was found that, with the data available, no
significant objective rules could be developed. Since the present upper air and reconnaissance coverage makes
an objective analysis practically impossible, this project has been dropped for the present. With an increase
in coverage, especially in the area south of 20N, this might still become a useful objective forecasting
tool.
bottom of page 46
- I. CHANGES IN SEA SURFACE TEMPERATURE (SST) RESULTING FROM THE TRANSITING OF TYPHOONS SHIRLEY AND
TRIX
- Typhoons SHIRLEY and TRIX originated and intensified to typhoon strength over warm tropical
waters (<~86°F) of the Western Pacific. The tracks of the typhoons (shown by dashed lines) were seldom
farther than 150 miles apart during their transit. The combined effect from the winds along these tracks was a
quantitative change in sea surface temperature (figure 3-12) between the mean temperature pattern of 1-5
September (figure 3-10) and that of 21-25 September (figure 3-11).
- Although the typhoon tracks traversed an area of fairly sparse data during the first three
days, a definite drop of sea surface temperature greater than 5°F was observed. This decrease of sea surface
temperature is believed to be primarily the result of wind mixing of the surface water with the cooler water
from below the relatively shallow isothermal layer of 100 to 200 feet.
- The typhoons recurved to be a more northerly track in the area of the warmer Kurishio
current. Again relatively shallow mixed layer depths (MLD) were encountered (figure 3-13) and wind mixing is
considered the primary factor in producing cooler sea surface temperature of greater than 5°F.
- Additional factors which contribute to the decrease of sea surface temperature are:
- 1. The decrease of incoming solar radiation due to increased cloud cover.
- 2. The presence of cooler water by precipitation.
- The latter process being more noticeable in lower latitudes where a greater difference exists between sea
surface temperature and the precipitation temperature.
- It appears evident that the passage of a typhoon over an area will result in a cooling effect
on sea surface temperature. The amount of cooling being dependent upon the intensity of the typhoon, typhoon
speed, and other factors previously mentioned..
- Further research into the effects of typhoons upon the sea surface may result in a prediction
method for determining the quantitative cooling in an area under their influence.
bottom of page 47
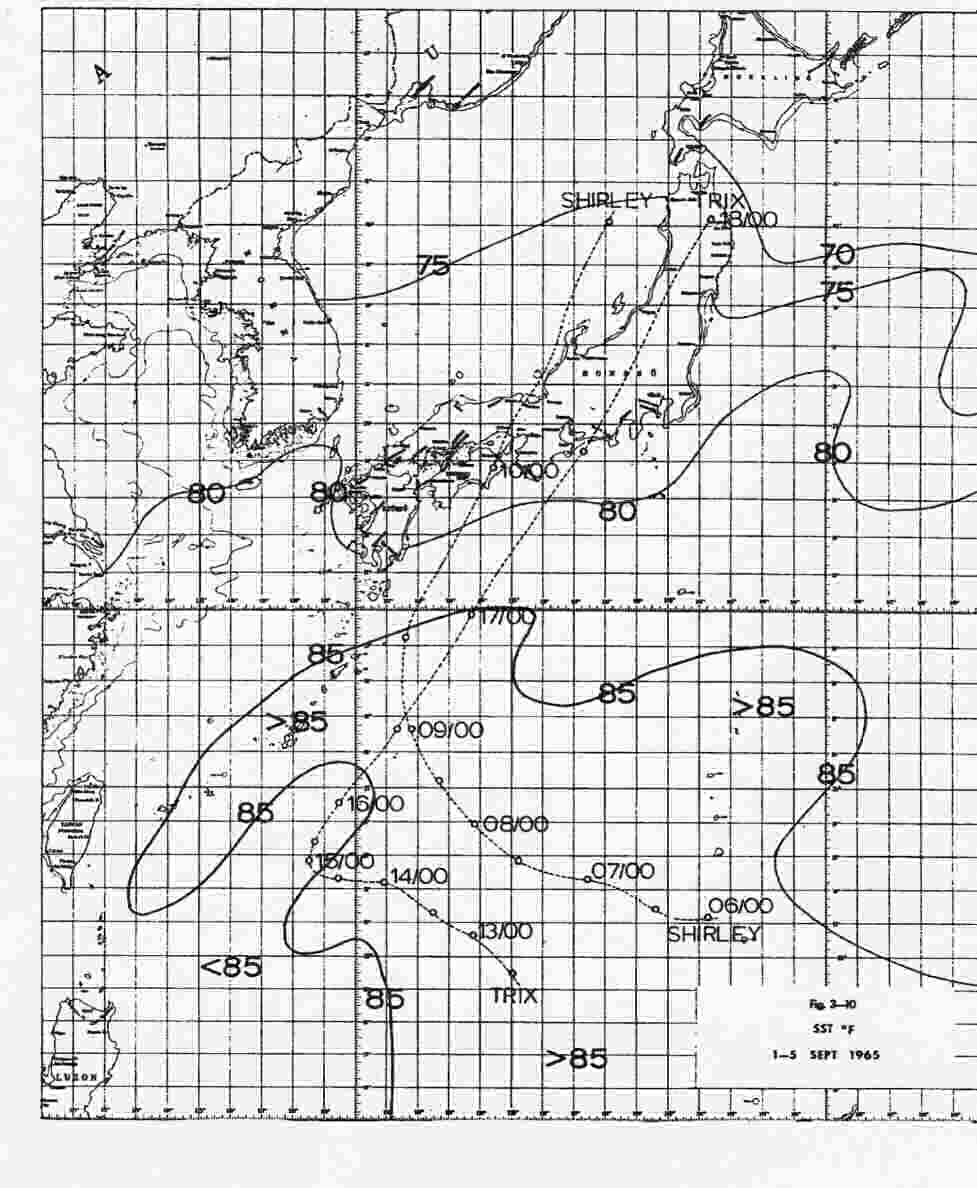 Fig. 3-10
SST °F 1 - 5 SEPT 1965
bottom of page 48
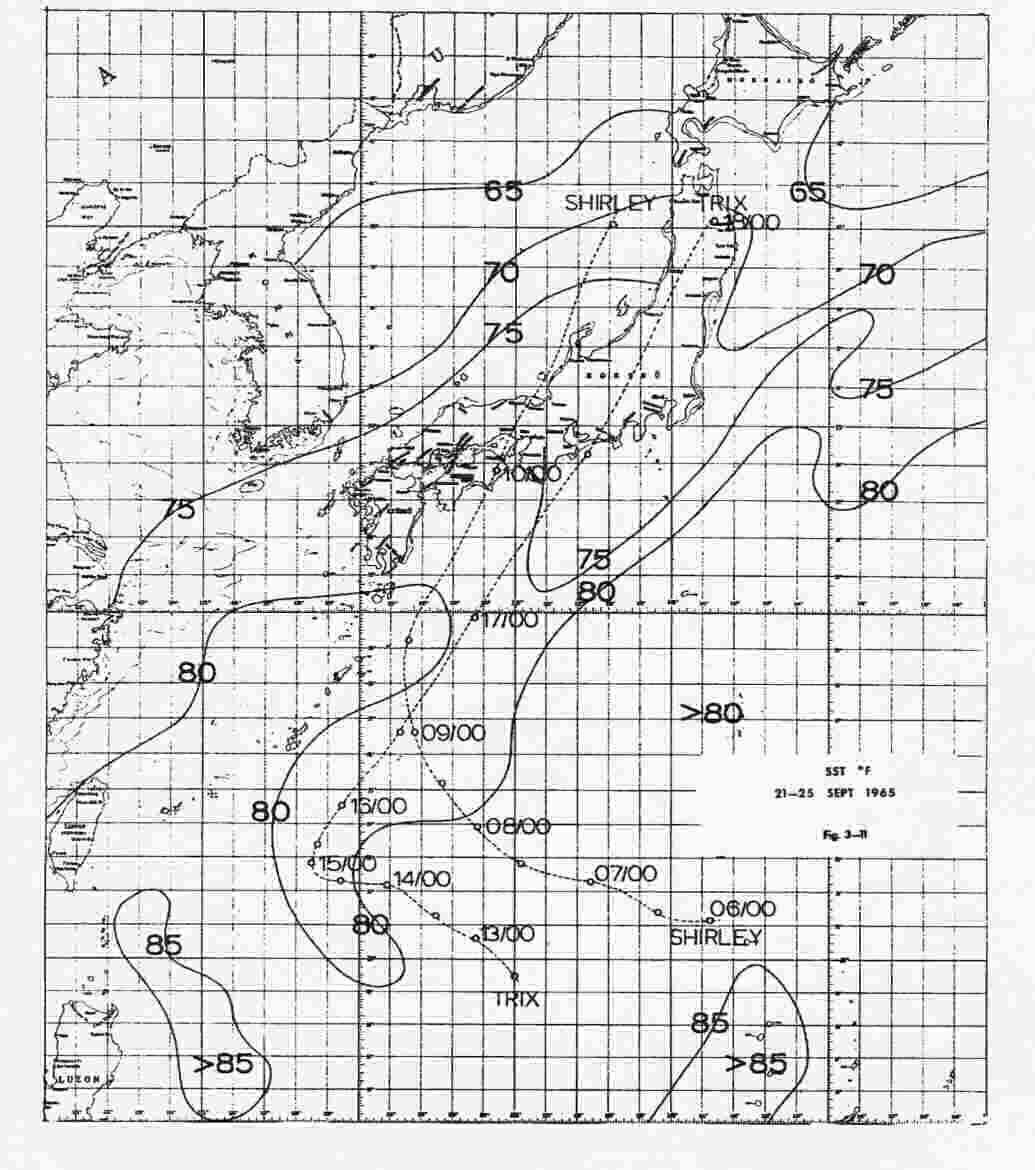 Fig. 3-11
SST °F 21 - 25 SEPT 1965
bottom of page 49
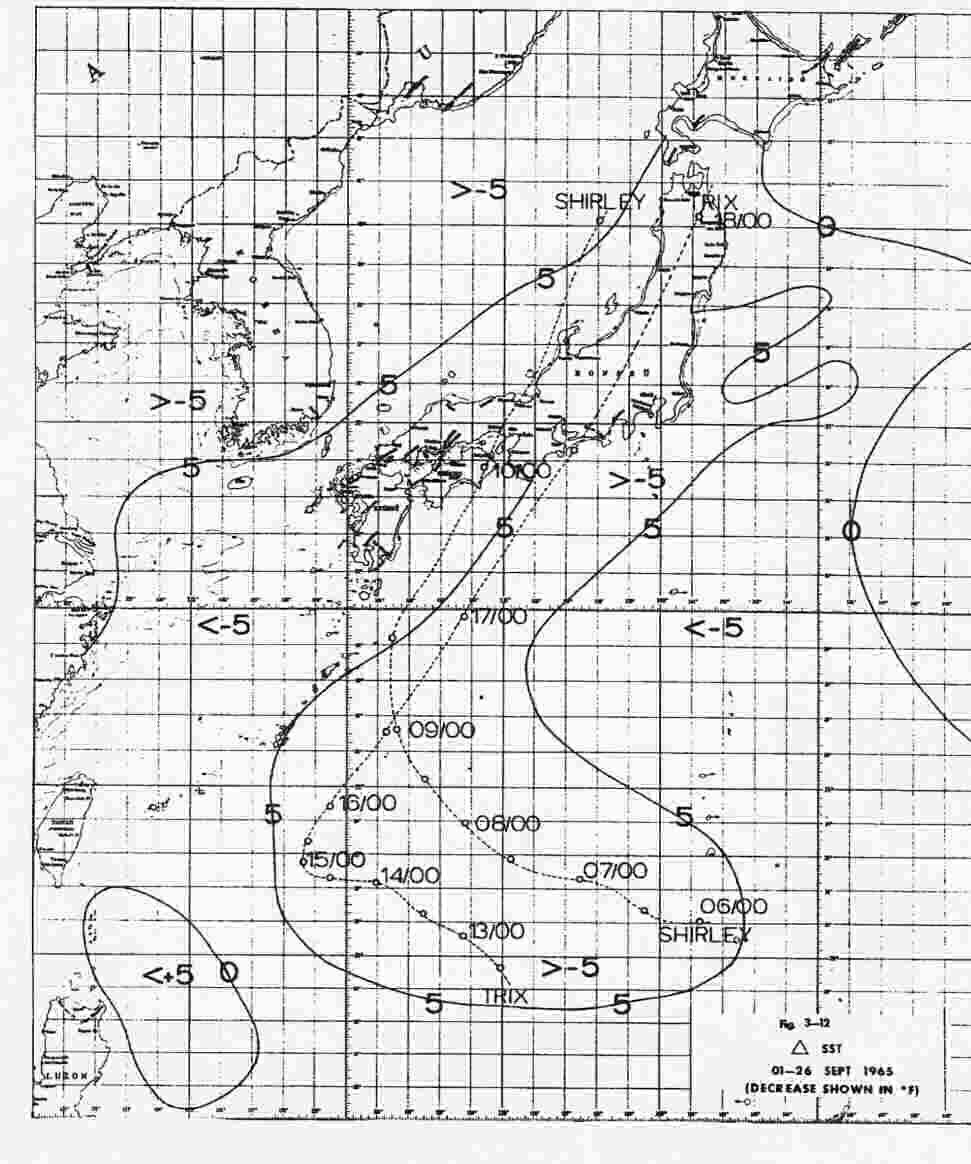 Fig. 3-12
delta SST 1 - 26 SEPT 1965
(DECREASE SHOWN IN °F)
bottom of page 50
-
- 3. 700mb temperature in center rises temporarily - may be as much as 6 degrees.
- 4. Winds at surface near the center decrease rapidly. (Also winds at 700mb, although to a lesser
extent).
- 5. The Surge found both at surface and 700mb on nose of cold air tongue 100-200 miles from the center.
Secondary surge on nose of warm air tongue 150-250 miles from center.
- 6. Cold air at 700mb moves around west, south and east quadrants of storm as a tongue approximately 75
miles wide centered about 100 miles from the center. The warm air is cut off as a pocket over the center
and gradually driven aloft. (The system becomes extratropical with all the characteristics of a fully
developed warm type occlusion.)
bottom of page 51
- J. CHANGES IN MIXED LAYER DEPTH (MLD) RESULTING FROM THE TRANSIT OF TYPHOONS SHIRLEY AND TRIX
- Typhoons SHIRLEY and TRIX attained typhoon intensity in waters having a mixed layer depth of
approximately 200 feet and transited over water of continually decreasing mixed layer depth. Within twenty four
hours of travel along their tracks, the typhoons appear to have caused an increase in mixed layer depth (figure
3-15), as relatively shallow initial layer depths were encountered. Figure 3-15 illustrates deepening of the
mixed layer depth in increments of 50 feet from the original conditions (figure 3-13) and those subsequent to
the passage of SHIRLEY and TRIX through the area. (figure 3-14)
- Greater horizontal gradients of mixed layer depth are encountered upon reaching the Kurishio
Region where 50 to 100 foot mixed layer depth is encountered. The combination of increased wind intensity and
the proportionally deeper wind mixing effect over an area of initially relatively shallower layer depths
accounts for the greater change depicted in figure 3-15. It may be noted that the mixed layer depth generally
increased between 50 and 100 feet throughout the area affected by the typhoons.
- During the period of 1 to 26 September there appeared to be a general deepening of the mixed
layer depth in the Kurishio Current region (figure 3-15). Although other factors were undoubtedly contributory
in this increase, it is believed that wind mixing was the primary influence. It is conceivable that the change
in mixed layer depth may be predicted given accurate wind intensities, typhoon movement, existing mixed layer
depth and the thermocline gradient in a given area.
bottom of page 52
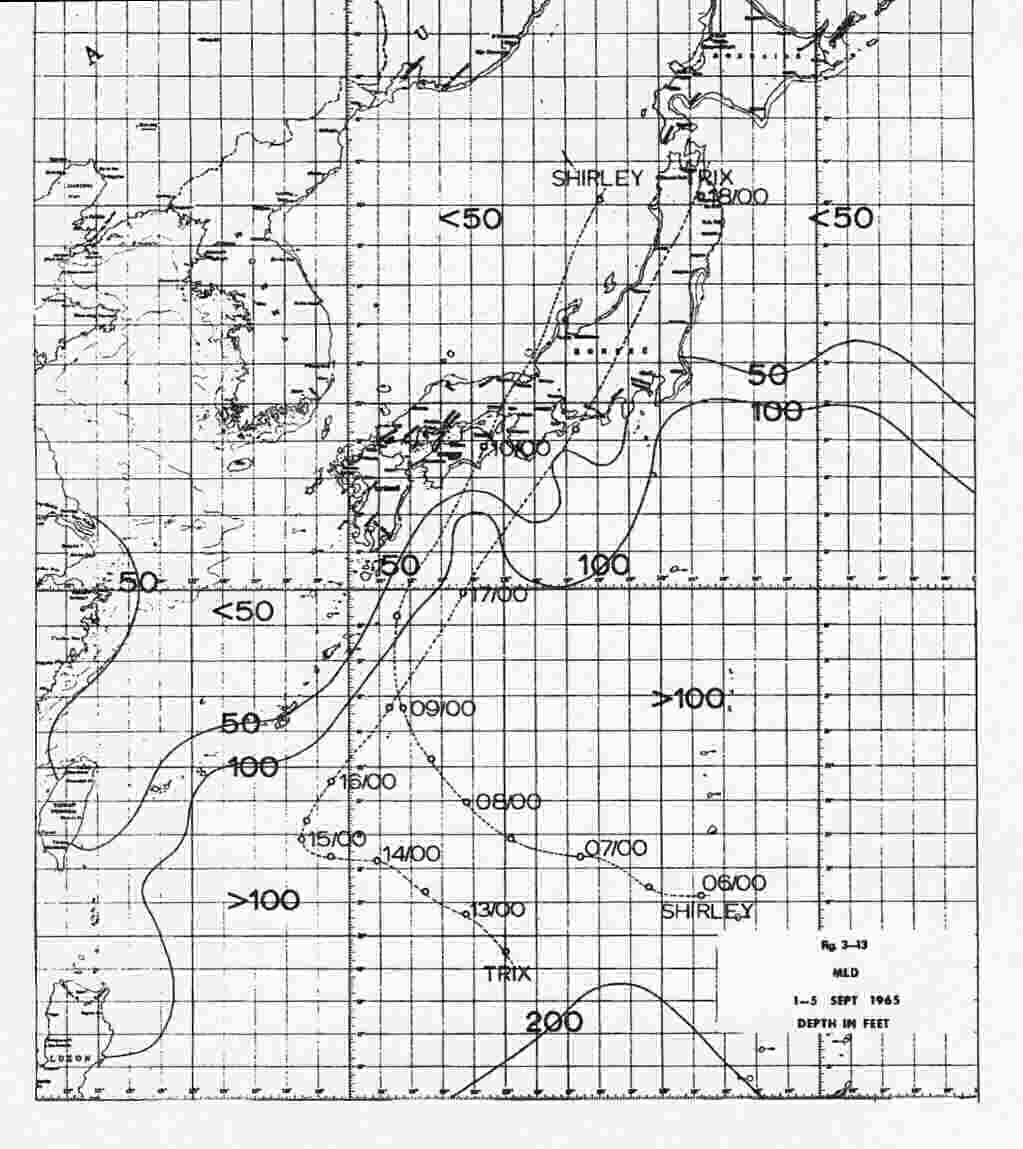 Fig. 3-13
MLD 1 - 5 SEPT 1965 DEPTH IN FEET
bottom of page 53
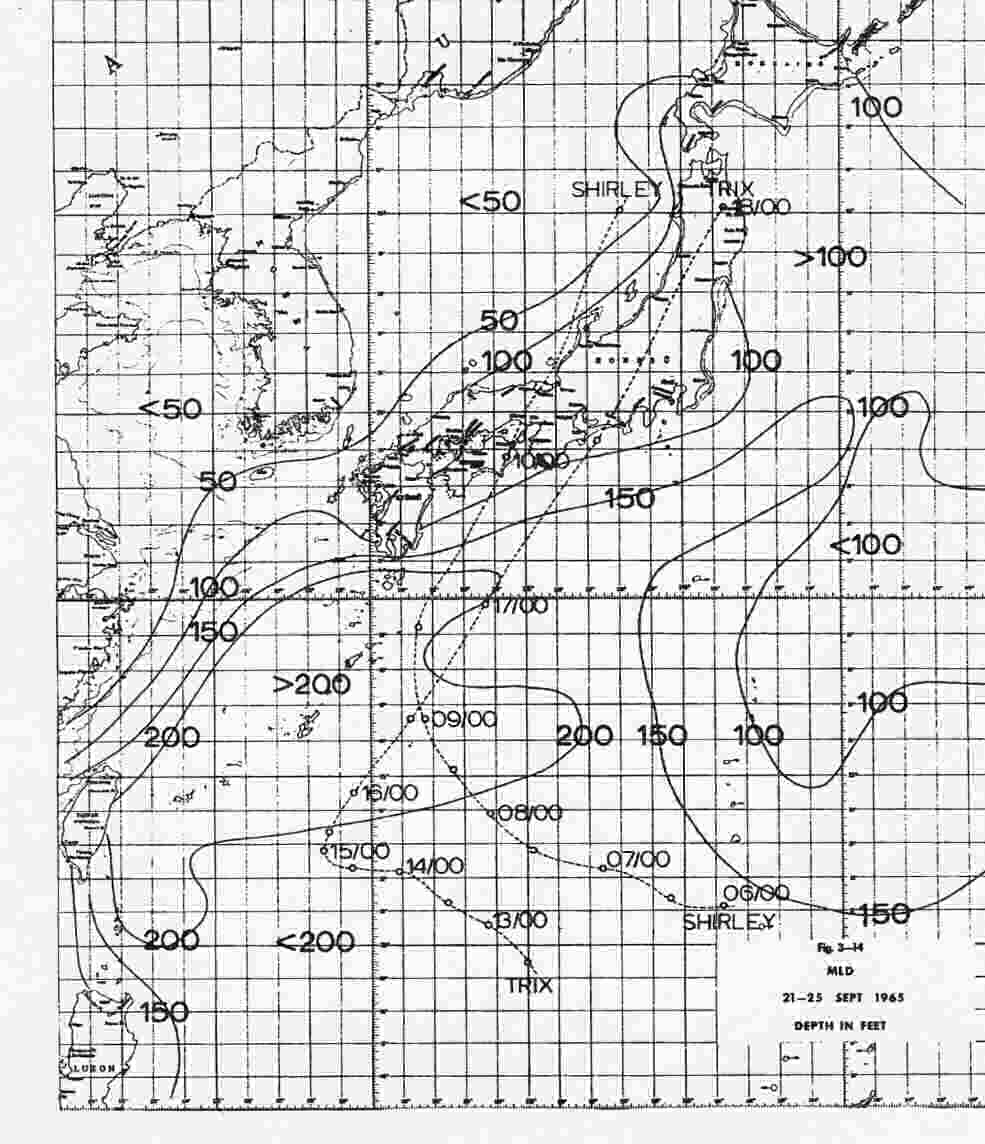 Fig. 3-14
MLD 21 - 25 SEPT 1965 DEPTH IN FEET
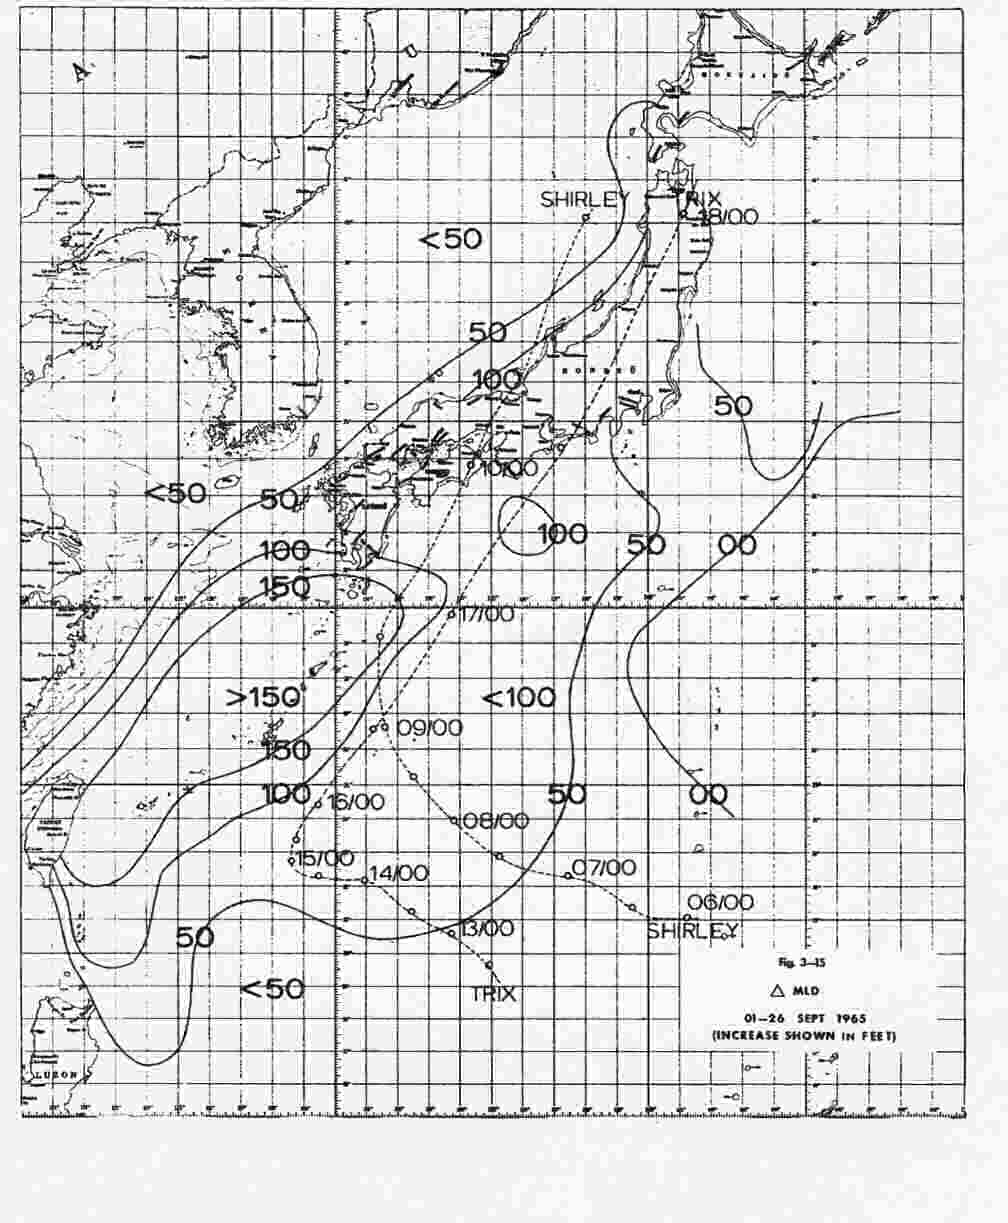 Fig. 3-15
delta MLD 1 - 26 SEPT 1965
(INCREASE SHOWN IN FEET)
bottom of page 54