
Page Updated 06/27/05

1965 JTWC STUDIES Chapter IV
SUMMARY OF TROPICAL CYLONES
- The following is a list of the topics discussed in this chapter;
- A. 1965 Forecast Vector Errors
- B. 1965 Forecast Errors (In Terms of Closest Distance to Best Track)
- C. Forecast Error Tabulation 1965
- D. Distance Between Operational Warning Posits and Best Track Posits
- E. 1965 Typhoon Tracks
- F. 1965 Tropical Cyclones
- The Joint Typhoon Warning Center issued a total of 805 tropical warnings on 21 Typhoons, 13
Tropical Storms and 6 Tropical Depressions in the Western Pacific Ocean in 1965. The previous record of 165
calendar days in warning established in 1961 was broken this year with JTWC spending 167 calendar days in
warning. During this time 2 or more tropical cyclones were carried on 55 days with 3 tropical cyclones carried
on 10 of these.
The following data for the JTWC area of responsibility is presented for comparison:
| COMPARATIVE WESTERN PACIFIC TROPICAL CYCLONE DATA | |||||||
|---|---|---|---|---|---|---|---|
| YEAR | 1959 | 1960 | 1961 | 1962 | 1963 | 1964 | 1965 |
| TOTAL NUMBER OF WARNINGS | 583 | 776 | 738 | 815 | 663 | 730 | 805 |
| CALENDAR DAYS OF WARNING | 137 | 157 | 165 | 154 | 146 | 153 | 167 |
| SUSPECT CYCLONES* | 32 | 26 | 27 | 17 | 5 | 7 | - |
| TROPICAL DEPRESSIONS | 7 | 3 | 11 | 9 | 3 | 5 | 6 |
| TROPICAL STORMS | 9 | 8 | 11 | 6 | 6 | 14 | 13 |
| TYPHOONS | 17 | 19 | 20 | 24 | 19 | 26 | 21 |
| TOTAL TROPICAL CYCLONES* | 65 | 56 | 69 | 56 | 33 | 52 | 40 |
| *Investigative flights were not assigned cyclone numbers during 1965 as had been done in the past,. | |||||||
- In the area of the North Pacific Ocean east of 180° warnings were issued on a total of 12
tropical cyclones of which one. Tropical Storm DOREEN, moved into the area between 140°W and 180°. (See Annex
A).
- 1965 was also a record year for "Super Typhoons" (maximum sustained surface winds of 130
knots or greater). A total of 11 typhoons were classified as "Super Typhoons". The most intense storm of 1965
was Typhoon DINAH (10 June - 19 June) with a maximum sustained surface wind of 160 knots.
| NUMBER OF SUPER TYPHOONS BY YEAR | ||||||
|---|---|---|---|---|---|---|
| 1959 | 1960 | 1961 | 1962 | 1963 | 1964 | 1965 |
| 8 | 4 | 6 | 6 | 8 | 6 | 11 |
- Another example of the Fujiwhara Effect occurred during 1965. The Fujiwhara Effect was
observed between Typhoons JEAN and IVY in the Philippine Sea during the period 29 July through 1 August. JEAN
became the predominate system and absorbed IVY on 1 August.
-
bottom of page 73
- A study was made (see Chapter III) on the rapid movement of some typhoons prior to becoming
extratropical. The best example of this phenomenon was Typhoon FAYE which reached a maximum forward speed of 65
knots on 26 November 1965, six hours prior to becoming extratropical. AMY, JEAN, TRIX and CARMEN were other
typhoons that reached forward speeds of 40 knots or more as much as 18 hours prior to becoming
extratropical.
- The 24, 48 and 72-hour mean forecast error for each typhoon was computed by two methods. In
addition to the standard mean vector forecast error table shown below, a computation of closest-distance error
from best track has been included for comparison. This error computation is based on the closest right angle
distance of the forecast position to the best track without regard to time. Possibly this will give the user a
better understanding of the ability of JTWC to forecast the effects of a typhoon on one particular area.
- The following tabulation of the forecast vector error for the past 16 years is given for
comparison:
| FORECAST VERIFICATION AVERAGE ERROR NAUTICAL MILES, | |||
|---|---|---|---|
| 24 HR | 48 HR | 72 HR | |
| 1950-58 | 170 | - | - |
| 1959 | 117 | 267 | - |
| 1960 | 177 | 354 | - |
| 1961 | 136 | 274 | - |
| 1962 | 144 | 287 | 476 |
| 1963 | 127 | 246 | 374 |
| 1964 | 133 | 284 | 429 |
| 1965 | 151 | 303 | 418 |
bottom of page 74
| 1965 FORECAST VECTOR ERRORS* | ||||||
|---|---|---|---|---|---|---|
| TYPHOON | 24 HR FORECASTS | 48 HR FORECASTS | 72 HR FORECASTS | |||
| NO. OF CASES | MEAN ERROR | NO. OF CASES | MEAN ERROR | NO. OF CASES | MEAN ERROR | |
| PATSY | 10 | 213 | 6 | 511 | - | - |
| WANDA | 6 | 99 | 2 | 280 | - | - |
| AMY | 17 | 210 | 13 | 417 | 8 | 677 |
| BABE | 16 | 164 | 12 | 340 | 5 | 437 |
| CARLA | 4 | 151 | - | - | - | - |
| DINAH | 26 | 87 | 20 | 136 | 16 | 161 |
| FREDA | 29 | 146 | 25 | 271 | 18 | 371 |
| HARRIET | 17 | 186 | 13 | 380 | 8 | 576 |
| IVY | 13 | 233 | 8 | 541 | 3 | 1054 |
| JEAN | 24 | 128 | 20 | 276 | 16 | 373 |
| LUCY | 29 | 169 | 25 | 329 | 19 | 481 |
| MARY | 14 | 107 | 10 | 154 | 5 | 170 |
| OLIVE | 17 | 138 | 13 | 284 | 9 | 449 |
| ROSE | 15 | 55 | 11 | 127 | 3 | 245 |
| SHIRLEY | 16 | 231 | 12 | 589 | 3 | 871 |
| TRIX | 27 | 138 | 23 | 302 | 18 | 426 |
| VIRGINIA | 11 | 289 | 7 | 615 | 3 | 1055 |
| BESS | 26 | 106 | 22 | 256 | 16 | 401 |
| CARMEN | 21 | 148 | 15 | 238 | 11 | 289 |
| DELIA | 23 | 152 | 17 | 277 | 11 | 484 |
| FAYE | 44 | 148 | 40 | 268 | 36 | 370 |
- AVERAGE ERROR 24 HR FORECASTS (405 CASES)... 151 MI
- AVERAGE ERROR 48 HR FORECASTS (314 CASES)... 303 MI
- AVERAGE ERROR 72 HR FORECASTS (208 CASES)... 418 MI
- *Includes Forecast Vector Errors during tropical storm intensity
-
bottom of page 75
| 1965 FORECAST ERRORS* (IN TERMS OF CLOSEST DISTANCE TO BEST TRACK) |
||||||
|---|---|---|---|---|---|---|
| TYPHOON | 24 HR FORECASTS | 48 HR FORECASTS | 72 HR FORECASTS | |||
| NO. OF CASES | MEAN ERROR | NO. OF CASES | MEAN ERROR | NO. OF CASES | MEAN ERROR | |
| PATSY | 10 | 91 | 6 | 327 | - | - |
| WANDA | 6 | 70 | 2 | 125 | - | - |
| AMY | 17 | 80 | 13 | 198 | 8 | 353 |
| BABE | 16 | 100 | 12 | 241 | 5 | 320 |
| CARIA | 4 | 85 | - | - | - | - |
| DINAH | 26 | 50 | 20 | 87 | 16 | 91 |
| FREDA | 29 | 65 | 25 | 87 | 18 | 103 |
| HARRIET | 17 | 73 | 13 | 120 | 8 | 163 |
| IVY | 13 | 124 | 8 | 333 | 3 | 802 |
| JEAN | 24 | 66 | 20 | 178 | 16 | 255 |
| LUCY | 29 | 106 | 25 | 209 | 19 | 290 |
| MARY | 14 | 62 | 10 | 116 | 5 | 143 |
| OLIVE | 17 | 109 | 13 | 231 | 9 | 361 |
| ROSE | 15 | 45 | 11 | 108 | 3 | 239 |
| SHIRLEY | 16 | 139 | 12 | 395 | 3 | 676 |
| TRIX | 27 | 81 | 23 | 183 | 18 | 276 |
| VIRGINIA | 11 | 133 | 7 | 184 | 3 | 227 |
| BESS | 26 | 78 | 22 | 194 | 16 | 284 |
| CARMEN | 21 | 69 | 15 | 109 | 11 | 106 |
| DELIA | 23 | 70 | 17 | 147 | 11 | 340 |
| FAYE | 44 | 78 | 40 | 134 | 36 | 173 |
- AVERAGE ERROR 24 HR FORECASTS (405 CASES)... 82 MI
- AVERAGE ERROR 48 HR FORECASTS (314 CASES)... 172 MI
- AVERAGE ERROR 72 HR FORECASTS (208 CASES)... 236 MI
- *Includes Forecast Errors during tropical storm intensity
-
bottom of page 76
| FORECAST ERROR TABULATION 1965 | |||||
|---|---|---|---|---|---|
| NUMBER OF CASES | VECTOR | RIGHT ANGLE | |||
| MEAN | R.M.S. | MEAN | R.M.S. | ||
| 24 hour | |||||
| TOTAL | 405 | 151 | 182 | 82 | 103 |
| BELOW 20N | 177 | 134 | 161 | 75 | 96 |
| 20N - 30N | 160 | 140 | 162 | 80 | 98 |
| ABOVE 30N | 67 | 222 | 263 | 106 | 130 |
| BELOW 35N | 375 | 142 | 170 | 78 | 100 |
| ABOVE 35N | 30 | 272 | 295 | 130 | 142 |
| 48 hour | |||||
| TOTAL | 314 | 303 | 358 | 172 | 211 |
| BELOW 20N | 111 | 261 | 314 | 149 | 189 |
| 20N - 30N | 137 | 281 | 333 | 173 | 214 |
| ABOVE 30N | 66 | 411 | 469 | 206 | 239 |
| BELOW 35N | 285 | 287 | 340 | 171 | 212 |
| ABOVE 35N | 29 | 459 | 499 | 179 | 204 |
| 72 hour | |||||
| TOTAL | 208 | 418 | 494 | 267 | 294 |
| BELOW 20N | 60 | 333 | 397 | 190 | 254 |
| 20N - 30N | 94 | 402 | 463 | 241 | 294 |
| ABOVE 30N | 54 | 542 | 627 | 279 | 333 |
| BELOW 35N | 184 | 386 | 451 | 269 | 295 |
| ABOVE 35N | 24 | 670 | 760 | 255 | 284 |
bottom of page 77
| DISTANCE BETWEEN OPERATIONAL WARNING POSITS AND BEST TRACK POSITS |
|||||
|---|---|---|---|---|---|
| CYCLONE | CASES | CYCLONE AVERAGE | MAX | MTN | |
| 1 | PATSY | 16 | 28 | 70 | 0 |
| 2 | RUTH | 18 | 77 | 252 | 0 |
| 3 | SARAH | 11 | 45 | 108 | 0 |
| 4 | THELMA | 5 | 65 | 104 | 9 |
| 5 | VERA | 3 | 30 | 39 | 22 |
| 6 | WANDA | 10 | 23 | 72 | 0 |
| 7 | AMY | 25 | 37 | 125 | 5 |
| 8 | T. D. | 4 | 82 | 125 | 42 |
| 9 | BABE | 20 | 22 | 77 | 5 |
| 10 | CARLA | 8 | 38 | 122 | 11 |
| 11 | DINAH | 34 | 15 | 48 | 0 |
| 12 | EMMA | 18 | 30 | 70 | 4 |
| 13 | T. D. | 7 | 65 | 90 | 40 |
| 14 | FREDA | 36 | 29 | 118 | 0 |
| 15 | GILDA | 23 | 45 | 144 | 5 |
| 16 | HARRIET | 25 | 35 | 125 | 3 |
| 17 | JEAN | 40 | 32 | 146 | 0 |
| 18 | IVY | 17 | 40 | 109 | 6 |
| 19 | KIM | 13 | 22 | 42 | 6 |
| 20; | LUCY | 33 | 20 | 99 | 0 |
| 21 | MARY | 18 | 26 | 146 | 0 |
| 22 | NADINE | 10 | 22 | 43 | 3 |
| 23 | T. D. | 10 | 70 | 215 | 12 |
| 24 | T. D. | 3 | 21 | 27 | 14 |
| 25 | OLIVE | 21 | 17 | 42 | 0 |
| 26 | POLLY | 12 | 47 | 120 | 0 |
| 27 | ROSE | 18 | 14 | 36 | 0 |
| 28 | SHIRLEY | 28 | 57 | 239 | 5 |
| 29 | TRIX | 33 | 30 | 123 | 4 |
| 30 | T. D. | 7 | 72 | 152 | 8 |
| 31 | VIRGINIA | 16 | 28 | 82 | 0 |
| 32 | WENDY | 39 | 50 | 194 | 0 |
| 33 | AGNES | 12 | 34 | 68 | 12 |
| 34 | BESS | 30 | 20 | 97 | 3 |
| 35 | CARMEN | 35 | 38 | 86 | 0 |
| 36 | T. D. | 7 | 24 | 42 | 0 |
| 37 | DELIA | 28 | 44 | 144 | 6 |
| 38 | ELAINE | 33 | 28 | 87 | 4 |
| 39 | FAYE | 49 | 33 | 163 | 0 |
| 40 | GLORIA | 12 | 69 | 206 | 3 |
| AVERAGE | 34.7 | ||||
bottom of page 78
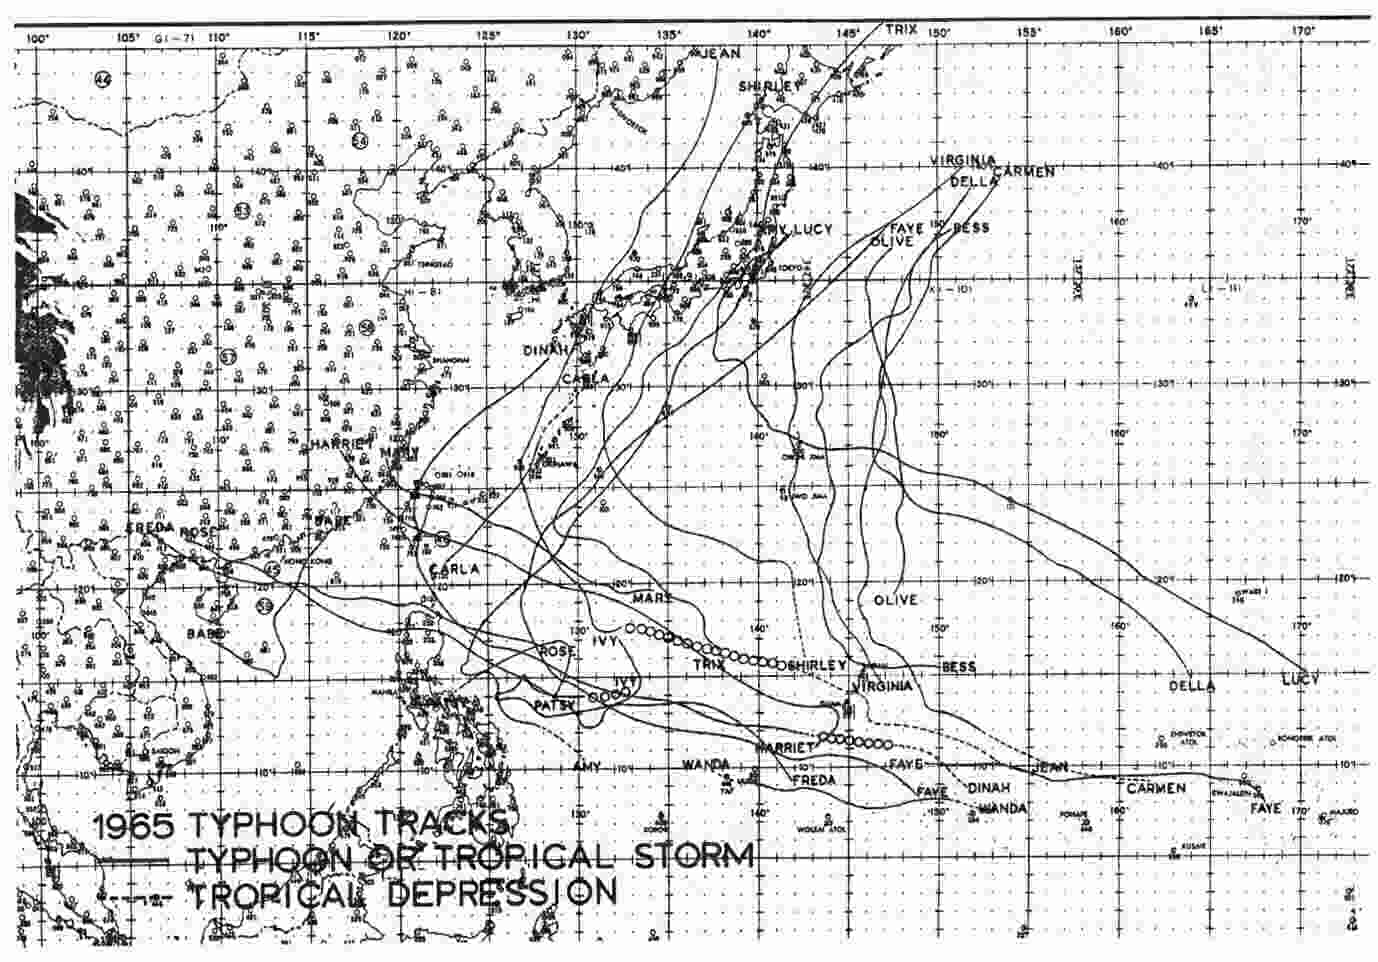 Typhoon Tracks - 1965
bottom of page 79
| 1965 TROPICAL CYCLONES | |||||||||||
|---|---|---|---|---|---|---|---|---|---|---|---|
| CYCL | TYPE | NAME | *DATE | *CALENDAR DAYS OF WARNING | *MAX SFC WNDS | MIN OBS SLP | MAX RADIUS SFC CIRC | TOTAL NO. WARNINGS ISSUED | NO. WARNINGS ISSUED AS TYPHOON | *DISTANCE TRAVELED | |
| 1 | T | PATSY | 19-Jan | JAN-23 | 5 | 65 | 989 | 375 | 17 | 6 | 619 |
| 2 | TS | RUTH | 21-Jan | JAN-25 | 5 | 60 | 996 | 490 | 18 | - | 2179 |
| 3 | TS | SARAH | 14-Feb | FEB-17 | 4 | 45 | 998 | 275 | 11 | - | 527 |
| 4 | TS | THELMA | 18-Feb | FEB-19 | 2 | 40 | 1001 | 200 | 5 | - | 208 |
| 5 | TS | VERA | 6-Mar | MAR-07 | 2 | 45 | 1003 | 300 | 4 | - | 122 |
| 6 | T | WANDA | 12-Apr | APR-14 | 3 | 65 | 998 | 250 | 11 | 2 | 914 |
| 7 | T | AMY | 21-May | MAY-27 | 7 | 100 | 976 | 275 | 25 | 10 | 2250 |
| 8 | th | 29-May | MAY-30 | 2 | 25 | 1000 | 250 | 4 | - | 90 | |
| 9 | T | BABE | 30-May | JUN-04 | 6 | 80 | 985 | 275 | 21 | 12 | 576 |
| 10 | T | CARLA | 1-Jun | JUN-03 | 3 | 120 | 991 | 225 | 8 | 4 | 605 |
| 11 | T | DINAH | 10-Jun | JUN-19 | 10 | 160 | 932 | 525 | 37 | 24 | 2795 |
| 12 | TS | EMMA | 18-Jun | JUN-21 | 8 | 50 | 994 | 350 | 20 | - | 1308 |
| 23-Jun | JUN-26 | ||||||||||
| 13 | th | 6-Jul | JUL-08 | 3 | 25 | 1003 | 300 . | 8 | - | 305 | |
| 14 | T | FREDA | 7-Jul | JUL-16 | 10 | 140 | 922 | 675 | 0.36 | 27 | 2400 |
| 15 | TS | GILDA | 13-Jul | JUL-14 | 6 | 60 | 986 | 550 | 25 | - | 1356 |
| 17-Jul | JUL-23 | ||||||||||
| 16 | T | HARRIET | 21-Jul | JUL-27 | 7 | 100 | 973 | 750 | 25 | 16 | 2080 |
| 17 | T | JEAN | 26-Jul | JUL-29 | 12 | 140 | 940 | 625 | 41 | 27 | 3565 |
| 31-Jul | AUG-07 | ||||||||||
| 18 | T' | IVY | 27-Jul | JUL-31 | 6 | 80 | 991 | 325 | 18 | 12 | 1100 |
| 19 | TS | KIM | 4-Aug | AUG-07 | 4 | 60 | 980 | 175 | 13 | - | 620 |
| 20 | T | LUCY | 15-Aug | AUG-23 | 9 | 150 | 940 | 425 | 33 | 27 | 2583 |
| 21 | T | MARY | 15-Aug | AUG-19 | 5 | 150 | 936 | 600 | 18 | 14 | 1000 |
| 22 | TS | NADINE | 16-Aug | AUG-18 | 3 | 60 | 996 | 200 | 10 | - | 450 |
| 23 | th | 26-Aug | AUG-28 | 3 | 25 | 1004 | 250 | 10 | - | 350 | |
| 24 | th | 26-Aug | AUG-26 | 1 | 25 | 1003 | 250 | 4 | - | 140 | |
| 25 | T | OLIVE | 28-Aug | SEP-02 | 6 | 150 | 936 | 550 | 21 | 17 | 1118 |
| 26 | TS | POLLY | 30-Aug | SEP-02 | 4 | 45 | 992 | 425 | 12 | - | 804 |
| 27 | T | ROSE | 1-Sep | SEP-05 | 5 | 100 | 968 | 400 | 19 | 16 | 1232 |
| 28 | T | SHIRLEY | 4-Sep | SEP-10 | 7 | 130 | 936 | 625 | 28 | 19 | 2255 |
| 29 | T | TRIX | 10-Sep | SEP-18 | 9 | 130 | 930 | 850 | 33 | 27 | 2497 |
| 30 | th | 13-Sep | SEP-14 | 2 | 25 | 999 | 200 | 7 | - | 225 | |
| 31 | T | VIRGINIA | 13-Sep | SEP-17 | 5 | 65 | 980 | 300 | 16 | 4 | 1858 |
| 32 | TS | WENDY | 16-Sep | SEP-25 | 10 | 50 | 986 | 400 | 39 | - | 2295 |
| 33 | TS | AGNES | 25-Sep | SEP-28 | 4 | 60 | 977 | 375 | 13 | - | 560 |
| 34 | T | BESS | 27-Sep | OCT-04 | 8 | 150 | 901 | 850 | 30 | 29 | 1775 |
| 35 | T | CARMEN | 1-Oct | OCT-09 | 10 | 150 | 916 | 825 | 37 | 18 | 2775 |
| 36 | th | 8-Oct | OCT-09 | 2 | 25 | 996 | 275 | 16 | - | 358 | |
| 37 | T | DELLA | 13-Oct | OCT-19 | 7 | 85 | 970 | 900 | 28 | 20 | 2100 |
| 38 | TS | ELAINE | 7-Nov | NOV-13 | 7 | 50 | 993 | 400 | 23 | - | 909 |
| 39 | T | FAYE | 14-Nov | NOV-25 | 13 | 135 | 925 | 700 | 49 | 21 | 4001 |
| 40 | TS | GLORIA | 18-Dec | DEC-21 | 4 | 40 | 1003 | 225 | 12 | - | 650 |
| TOTALS | 167 | 805 | 352 | ||||||||
bottom of page 80